A possible second large subglacial impact crater in northwest Greenland
As this visualization draws near to the northwest coast of Greenland where the Hiawatha Glacier is located, the ice sheet is cut away to show the topography of Greenland's bedrock lying beneath the ice sheet at 20x vertical exaggeration. The Hiawatha crater is clearly visible in the topography. Farther inland another, subtler circular depression can be seen. The edge picks of this depression are shown as vertical bars, while potential central peaks are marked by orange pyramids. As we rotate around the depression, the location of the best-fit circle to the edge picks appears and that circle's center is marked with an "X". This circle matches well with both the edge of the bedrock depression and also the residual slope of the ice surface as it flows over this depression (not shown), strongly supporting the inference that this depression is another large impact crater.
This video is also available on our YouTube channel.
It is increasingly rare to find new large impact craters on Earth, let alone such craters buried beneath ice. This study by MacGregor et al. describes a possible impact crater buried beneath two kilometers of ice in northwest Greenland. The circular structure is more than 36 kilometers wide, and both its shape and other geophysical properties are consistent with an impact origin. If eventually confirmed as an impact crater, it would be only the second found beneath either of Earth’s ice sheets. The first was the Hiawatha impact crater, which is also in northwest Greenland and only 183 kilometers away from this new structure, so this team also evaluated whether these two craters could be related. They are similarly sized, but the candidate second crater appears more eroded and ice above it is much less disturbed than above the Hiawatha impact crater. Statistical analysis of the frequency of two unrelated but nearby large impacts indicates that it is improbable but not impossible that this pair is unrelated. This study expands knowledge of the impact history of the Earth and raises the question as to how many other impact craters buried beneath ice have yet to be found.

An image showing the location of the second possible impact crater in relation to the location of the Hiawatha impact crater with labels.
An image showing the location of the second possible impact crater in relation to the location of the Hiawatha impact crater without labels.
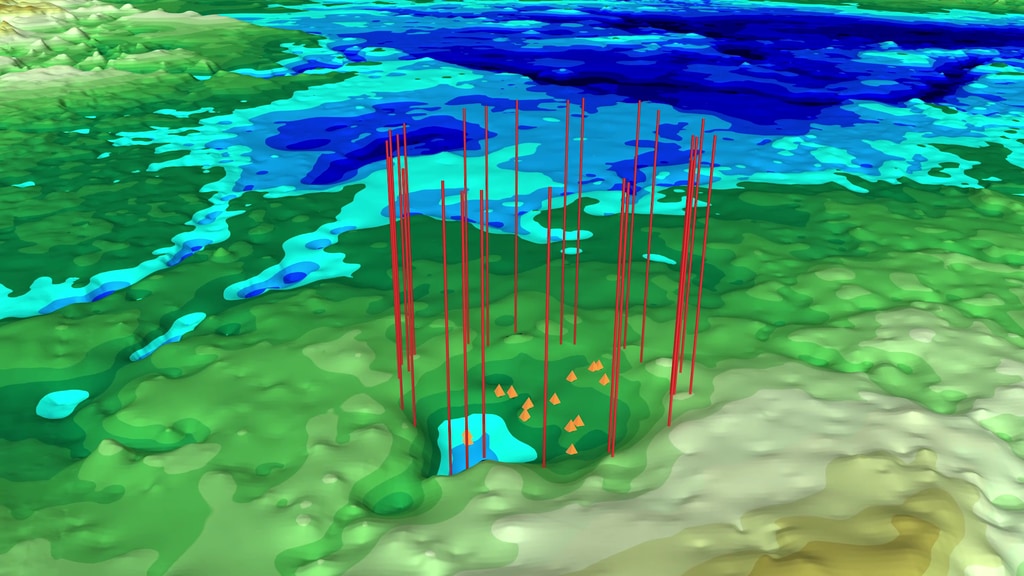
The second possible impact crater where the edge points are marked with vertical bars running through the ice sheet and the peak points are marked with small orange pyramids.
The second possible impact crater with the rim outline traced on the topography and also repeated at a level of 400 meters. An "X" marks the central peak of the crater.
The another view of the second possible impact crater with the rim outline traced on the topography and also repeated at a level of 400 meters. An "X" marks the central peak of the crater.
The colorbar indicating the elevation of Greenland's bed topography
Credits
Please give credit for this item to:
NASA's Scientific Visualization Studio
The Blue Marble data is courtesy of Reto Stockli (NASA/GSFC).
-
Visualizer
-
Cindy Starr
(Global Science and Technology, Inc.)

-
Cindy Starr
(Global Science and Technology, Inc.)
-
Project support
- Joycelyn Thomson Jones (NASA/GSFC)
- Leann Johnson (Global Science and Technology, Inc.)
- Eric Sokolowsky (Global Science and Technology, Inc.)
-
Technical support
- Laurence Schuler (ADNET Systems, Inc.)
- Ian Jones (ADNET Systems, Inc.)
Related papers
MacGregor, J. A., Bottke, W. F., Jr, Fahnestock, M. A., Harbeck, J. P., Kjær, K. H., Paden, J. D., Stillman, D. E., & Studinger, M. (2018). A possible second large subglacial impact crater in northwest Greenland. Geophysical Research Letters, 45. https://doi.org/10.1029/2018GL078126
MacGregor, J. A., Bottke, W. F., Jr, Fahnestock, M. A., Harbeck, J. P., Kjær, K. H., Paden, J. D., Stillman, D. E., & Studinger, M. (2018). A possible second large subglacial impact crater in northwest Greenland. Geophysical Research Letters, 45. https://doi.org/10.1029/2018GL078126
Datasets used
-
BMNG (Blue Marble: Next Generation) [Terra and Aqua: MODIS]
ID: 508Credit: The Blue Marble data is courtesy of Reto Stockli (NASA/GSFC).
This dataset can be found at: http://earthobservatory.nasa.gov/Newsroom/BlueMarble/
See all pages that use this dataset -
10 km Daily Sea Ice Concentration [SHIZUKU (GCOM-W1): AMSR2]
ID: 795Credit: AMSR2 data courtesy of the Japan Aerospace Exploration Agency (JAXA).
See all pages that use this dataset -
10 km Daily 89 GHz Brightness Temperature [SHIZUKU (GCOM-W1): AMSR2]
ID: 796Credit: AMSR2 data courtesy of the Japan Aerospace Exploration Agency (JAXA).
See all pages that use this dataset -
MODIS Mosaic of Greenland (MOG) Image Map [Terra: MODIS]
ID: 858 -
BedMachine V3: Bed Topography and Ocean Bathymetry of Greenland (BedMachine V3: Bed Topography and Ocean Bathymetry of Greenland)
ID: 1017A new compilation of Greenland bed topography that assimilates seafloor bathymetry and ice thickness data through a mass conservation approach.
See all pages that use this dataset
Note: While we identify the data sets used on this page, we do not store any further details, nor the data sets themselves on our site.
Related
- ID: 13146
 Produced Video
Release date
This page was originally published on Monday, February 11, 2019.
This page was last updated on Sunday, February 2, 2025 at 10:39 PM EST.