Inside Hurricane Maria in 360°
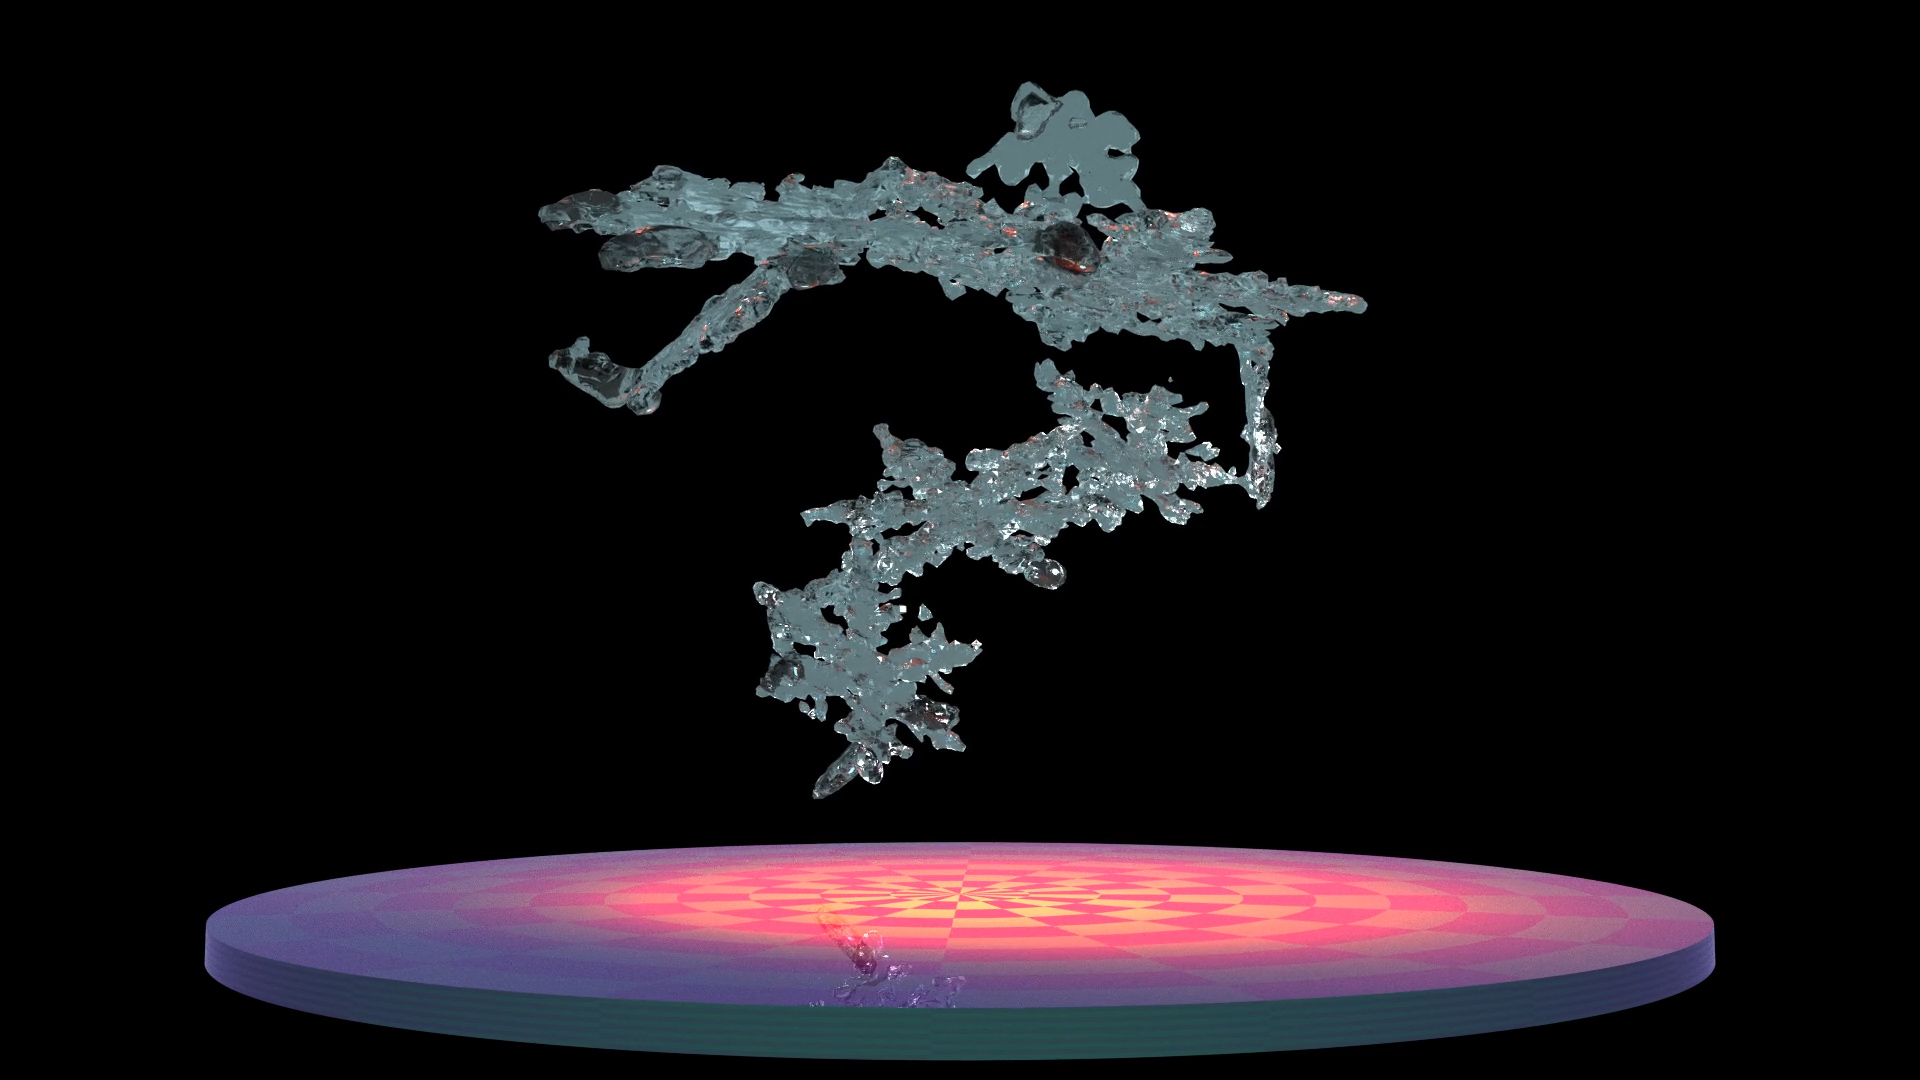
Tour Hurricane Maria in a whole new way! Late on September 17, 2017 (10:08 p.m. EDT) Category 1 Hurricane Maria was strengthening in the Atlantic Ocean when the Global Precipitation Measurement (GPM) mission's Core Observatory flew over it. The Dual Frequency Precipitation Radar, measuring in a narrow band over the storm center, shows 3-D estimates of rain, with snow at higher altitudes. The tall "hot towers" characteristic of deepening hurricanes are actually topped by snow! Surface rainfall rates estimated by the GPM Microwave Imager paint the surface over a wider swath. During the tour, you'll see the radar-observed rain intensities displayed three different ways in various parts of the storm. Then, for the first time you'll see estimates of the precipitation particle sizes, which the GPM DPR is uniquely capable of showing, and which provide important insights into storm processes.
GPM is a joint mission between NASA and the Japanese space agency JAXA.
A set of smoothly animated viewing directions were chosen to show a portion of this 360 movie.
Example of 360 video playback of Hurricane Maria 360. In this example, the view is moved around looking at various locations within the scene. You should try this on your own and choose you own views!
Visualization of Hurricane Maria. These are full 360 degree frames. These fames appear warped because they include the entire 360 degree view.
This video is also available on our YouTube channel.
Credits
Please give credit for this item to:
NASA's Scientific Visualization Studio
-
Visualizers
-
Greg Shirah
(NASA/GSFC)

-
Kel Elkins
(USRA)
-
Alex Kekesi
(Global Science and Technology, Inc.)
- Horace Mitchell (NASA/GSFC)
- Devika Elakara (GSFC Interns)
-
Greg Shirah
(NASA/GSFC)
-
Scientists
-
George Huffman
(NASA/GSFC)
- Dalia B Kirschbaum (NASA/GSFC)
- Stephen J. Munchak (University of Maryland)
- Scott Braun (NASA/GSFC)
-
George Huffman
(NASA/GSFC)
-
Technical support
- Laurence Schuler (ADNET Systems, Inc.)
- Ian Jones (ADNET Systems, Inc.)
-
Producers
- Ryan Fitzgibbons (USRA)
- Joy Ng (USRA)
-
Support
- Joycelyn Thomson Jones (NASA/GSFC)
- Leann Johnson (Global Science and Technology, Inc.)
Missions
This page is related to the following missions:Series
This page can be found in the following series:Datasets used
-
[GOES]
ID: 22 -
Rain Rates (Surface Precipitation) [GPM: GMI]
ID: 822Credit: Data provided by the joint NASA/JAXA GPM mission.
See all pages that use this dataset -
Volumetric Precipitation data (Ku) [GPM: DPR]
ID: 830Credit: Data provided by the joint NASA/JAXA GPM mission.
See all pages that use this dataset -
IMERG
ID: 863This dataset can be found at: http://pmm.nasa.gov/sites/default/files/document_files/IMERG_ATBD_V4.4.pdf
See all pages that use this dataset
Note: While we identify the data sets used on this page, we do not store any further details, nor the data sets themselves on our site.
Related
- ID: 13071
 Produced Video
Used as a Source In
- ID: 4742
 Visualization
 - ID: 13079
![This is a 360° video that can be downloaded and viewed on 360° video platforms such as YouTube and Facebook. Complete transcript available.Music credit: "The Answer" by Laurent Levesque [SACEM] from Killer Tracks](/vis/a010000/a013000/a013079/Inside_Hurricane_Maria_in_360.00001_print.jpg) Produced Video
Produced Video
Release date
This page was originally published on Thursday, October 4, 2018.
This page was last updated on Sunday, January 5, 2025 at 11:43 PM EST.