Instabilities in Very Young Neutron Stars: Density
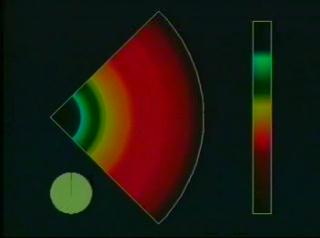
This simulation shows the first 20 milliseconds in the life of a neutron star which is formed in a Type II supernova. After an initial collapse phase, the neutron star becomes unstable to convection. The resulting convective motions destroy the spherical symmetry of the star and rapidly mix the inner regions. In addition, the neutrino flux from the neutron star will be non-spherical and will be significantly enhanced by the convective motions. This may have major implications for the Type II supernova mechanism. The calculation was performed using the Piecewise-Parabolic Method for hydrodynamics. The computational grid contained 300 zones in radius and 200 zones in angle. The inner 200 zones in radius were uniformly spaced, ranging from the inner boundary at 25 km to 175 km. The outer 100 zones were non-uniformly spaced and stretched to 2000 km. Only the inner 200 zones are plotted. The inner boundary was treated as a hard sphere. At the outer boundary, zero gradients for all the variables were assumed. Periodic boundary conditions were used along the sides of the grid. The following sequence shows the density evolution for 20 milliseconds after the shock stalls. The density is plotted on a log scale. Values range from 10^9 gm/cm^3 at the outer boundary to 1.4 x 10^12 gm/cm^3 at the inner boundary.
Evolution of the density during the first 20 milliseconds in the life of a neutron star formed from a Type II supernova

Video slate image reads "The following sequence shows density evolution for 20 milliseconds after the shock stalls. The density is plotted on a log scale. Values range from 109gm cm-3 at the outer boundary to 1.4 x 10¹²gm cm-3 at the inner boundary."
Credits
Please give credit for this item to:
NASA/Goddard Space Flight Center
Scientific Visualization Studio
-
Animators
- Bruce Fryxell (NASA/GSFC)
- Pamela ONeil (NASA)
-
Scientists
- Bruce Fryxell (NASA/GSFC)
- Adam Burrows (The University of Arizona)
Series
This page can be found in the following series:Related papers
Burrows, A., and Fryxell, B., 1993, ApJ, 418, L33
Burrows, A., and Fryxell, B., 1993, ApJ, 418, L33
Alternate Versions
- ID: 1381
 Visualization
Release date
This page was originally published on Saturday, February 12, 1994.
This page was last updated on Wednesday, May 3, 2023 at 2:00 PM EDT.