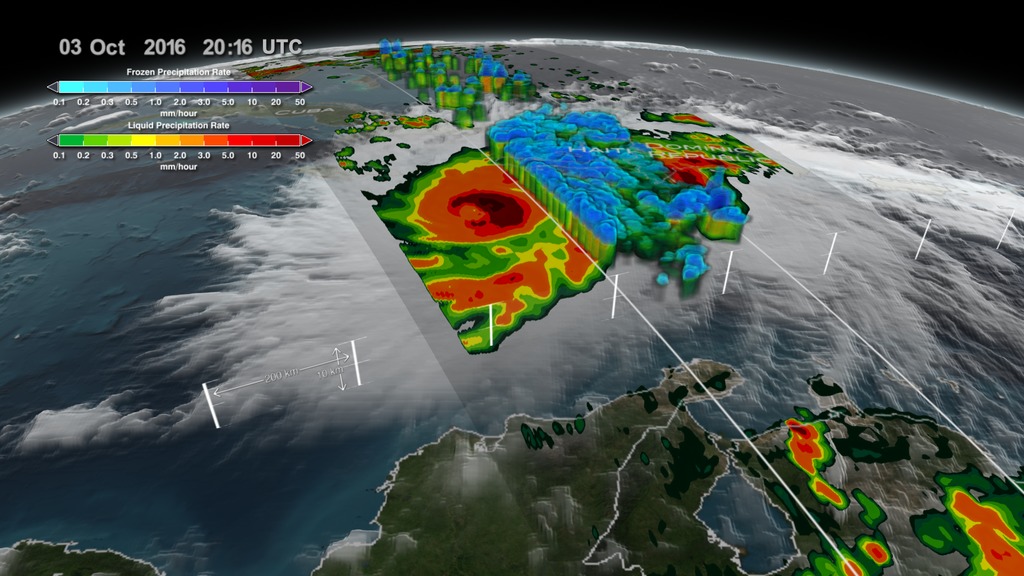
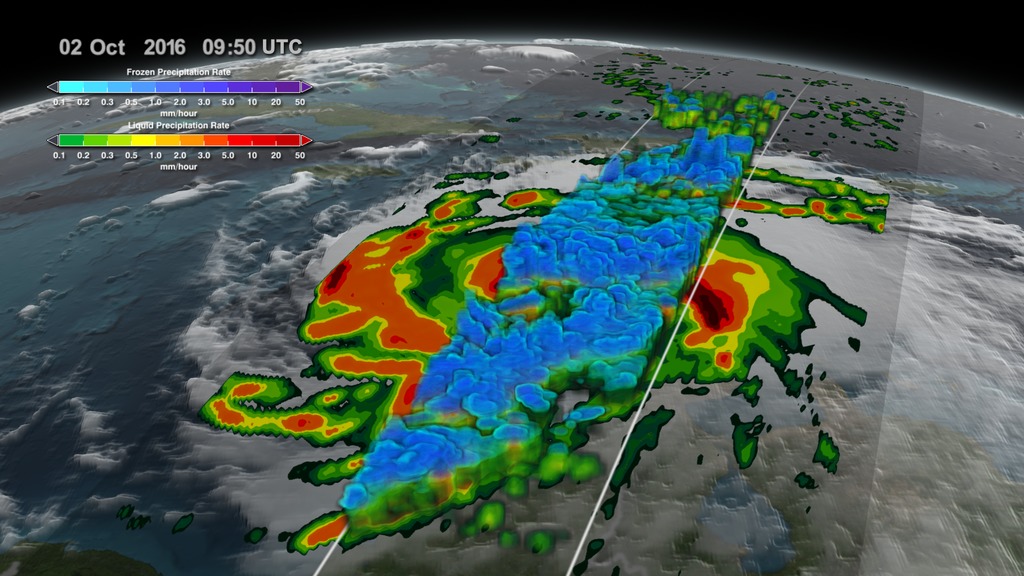
Category 4 Hurricane Matthew on October 2, 2016
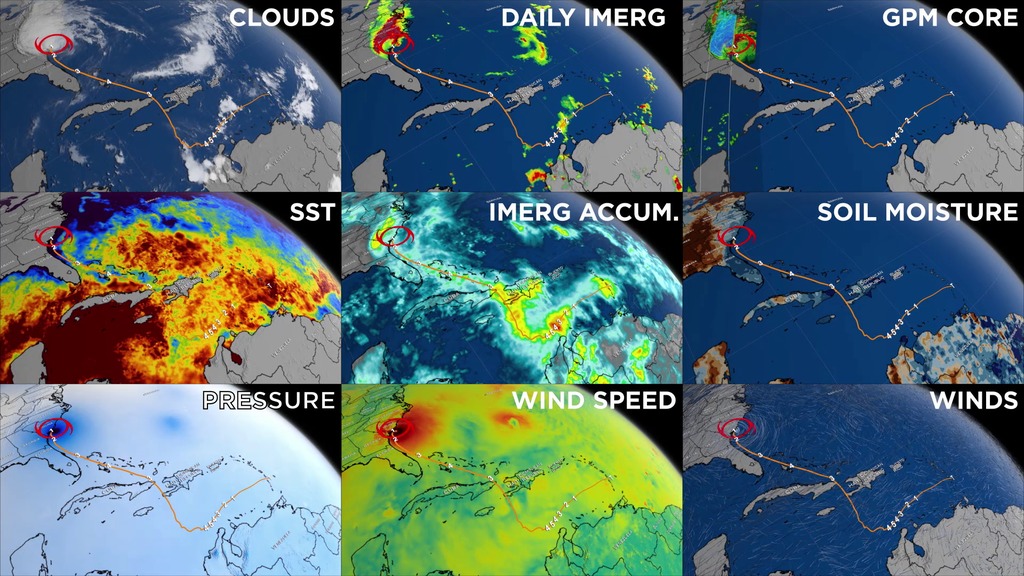
This data visualization tracks Hurricane Matthew as it intensifies to a Category 5 Hurricane and stops as Matthew turns into a Category 4 Hurricane on October 2, 2016. GPM's GPROF and DPR data swathes are then revealed to show the internal precipitation structure of this strong storm. After most of the DPR data is pulled away, a static 3D wind field is then shown to reveal the flow of air within the structure. DPR is then draped back over the wind fields to show the two datasets together. The winds are derived from GEOS-5.
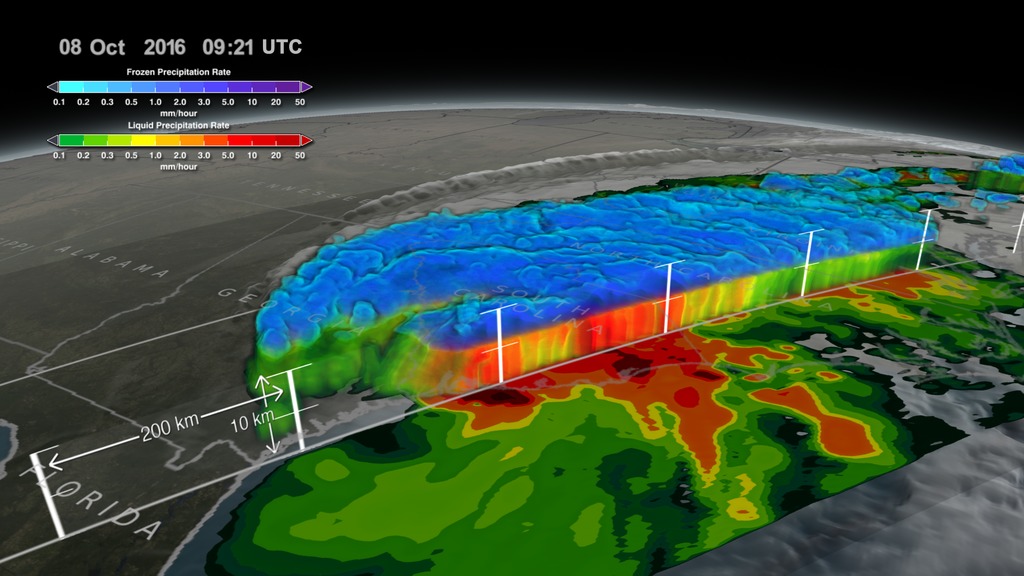
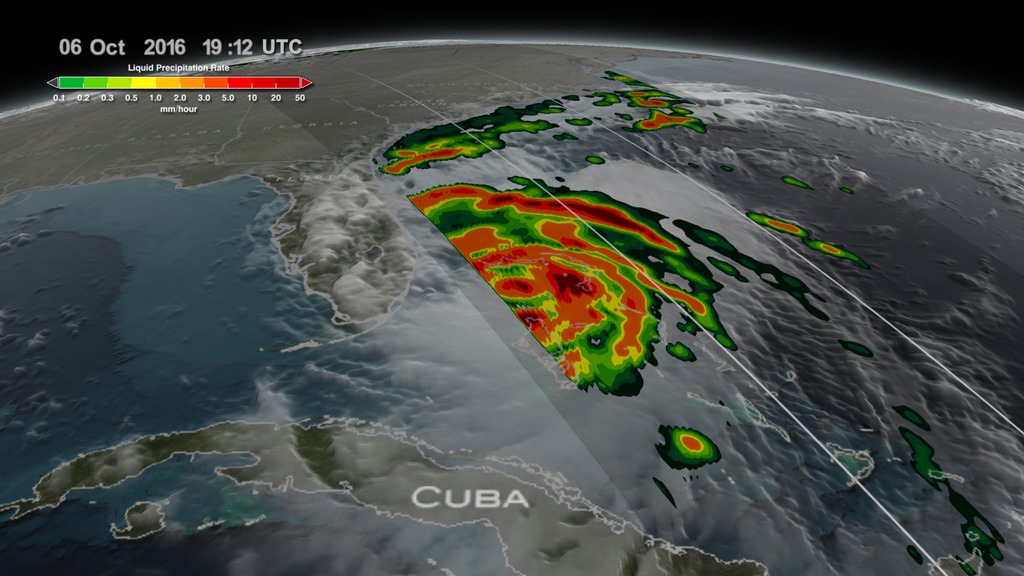
NASA's Global Precipitation Measurement mission or GPM core observatory satellite flew over Hurricane Matthew as the category 4 hurricane on October 2, 2016 shortly after it downgraded from a category 5 hurricane.
The GPM Core Observatory carries two instruments that show the location and intensity of rain and snow, which defines a crucial part of the storm structure – and how it will behave. The GPM Microwave Imager sees through the tops of clouds to observe how much and where precipitation occurs, and the Dual-frequency Precipitation Radar observes precise details of precipitation in 3-dimensions.
GPM data is part of the toolbox of satellite data used by forecasters and scientists to understand how storms behave. GPM is a joint mission between NASA and the Japan Aerospace Exploration Agency. Current and future data sets are available with free registration to users from NASA Goddard's Precipitation Processing Center website.
Credits
Please give credit for this item to:
NASA's Scientific Visualization Studio Data provided by the joint NASA/JAXA GPM mission.
-
Data visualizers
-
Alex Kekesi
(Global Science and Technology, Inc.)

-
Greg Shirah
(NASA/GSFC)
- Horace Mitchell (NASA/GSFC)
-
Alex Kekesi
(Global Science and Technology, Inc.)
-
Producer
- Ryan Fitzgibbons (USRA)
-
Scientists
- Gail Skofronick Jackson (NASA/GSFC)
- Dalia B Kirschbaum (NASA/GSFC)
-
George Huffman
(NASA/GSFC)
-
Technical support
- Laurence Schuler (ADNET Systems, Inc.)
- Ian Jones (ADNET Systems, Inc.)
Missions
This page is related to the following missions:Series
This page can be found in the following series:Datasets used
-
[GOES: IR4]
ID: 33 -
Rain Rates (Surface Precipitation) [GPM: GMI]
ID: 822Credit: Data provided by the joint NASA/JAXA GPM mission.
See all pages that use this dataset -
Volumetric Precipitation data (Ku) [GPM: DPR]
ID: 830Credit: Data provided by the joint NASA/JAXA GPM mission.
See all pages that use this dataset
Note: While we identify the data sets used on this page, we do not store any further details, nor the data sets themselves on our site.
Related
- ID: 5361
 Visualization
 - ID: 4575
 Visualization
 - ID: 4543
 Visualization
 - ID: 4512
 Visualization
 - ID: 4511
 Visualization
 - ID: 4508
 Visualization
 - ID: 4507
 Visualization
Release date
This page was originally published on Sunday, January 22, 2017.
This page was last updated on Sunday, February 2, 2025 at 10:31 PM EST.