Early 2016 Winter Storm Melts Arctic Sea Ice
This visualization starts with a global view of the Western hemisphere. The viewer then moves in over the arctic on December 27, 2015. Winds and air temperature fade in as time moves forward. A low pressure system then moves in pushing warm air ahead of it. The warm air moves over the Arctic sea ice, contributing to dramatic melting of the sea ice concentration in this region.
Arctic sea ice grows during the winter months, reaching its largest extent sometime in March. When something disrupts the cold, dry, winter Arctic atmosphere, sea ice can feel the effects, and these impacts may linger through the season. At the end of December 2015, a low pressure system formed in the north Atlantic and swept into the central Arctic, disrupting sea ice formation. As a result of this weather event, the concentration of sea ice in this region decreased by around ten percent. Sea ice extent stayed low throughout the month of January and large parts of the region remained unseasonably ice-free, which probably helped contribute to a record low Arctic sea ice maximum.

Sea ice concentration difference colorbar from December 28, 2015 to January 6, 2016. Deepening blue indicates more sea ice concentration. Deepening red indicates less sea ice concentration.
Air temperature colorbar.
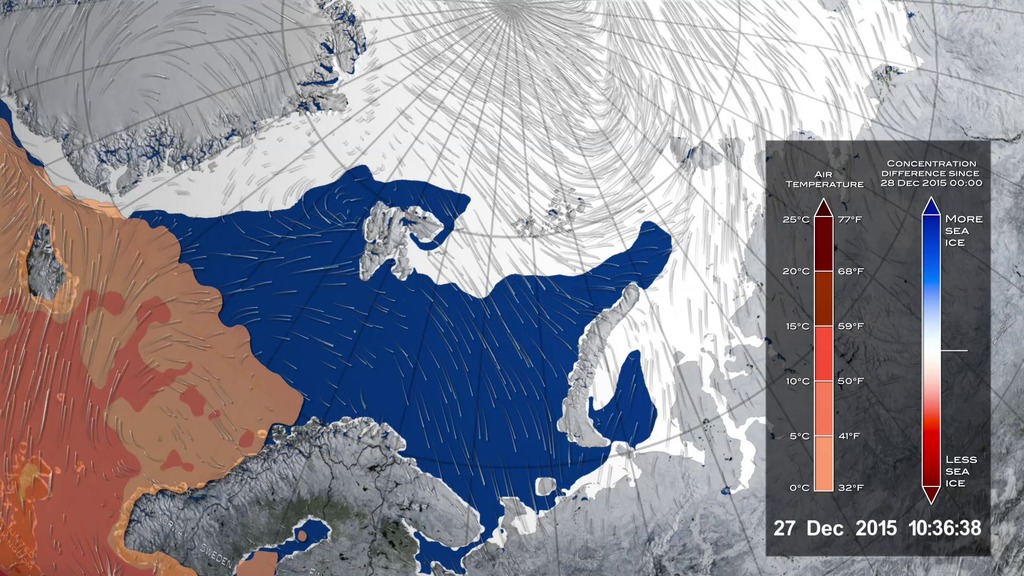
Print resolution still showing the difference in sea ice concentration from December 28, 2015 to January 6, 2016.
Print resolution still showing both the sea ice concentration difference along with air temperature and wind data.
- Arctic Ice Thickness
- Atmosphere
- Atmospheric Temperature
- Atmospheric Winds
- Atmospheric/ocean Indicators
- Climate Indicators
- Cryology
- Cryosphere
- Cryospheric Indicators
- Earth Science
- HDTV
- Hyperwall
- Oceans
- Physical oceanography
- Sea Ice
- Sea Ice Concentration
- Sea ice Motion
- Temperature Indicators
- Temperature Profiles
- Wind Tendency
Credits
Please give credit for this item to:
NASA's Scientific Visualization Studio
-
Visualizer
-
Alex Kekesi
(Global Science and Technology, Inc.)

-
Alex Kekesi
(Global Science and Technology, Inc.)
-
Scientists
- Linette Boisvert
- Alek A. Petty (University of Maryland)
-
Producers
- Kayvon Sharghi (USRA)
- Kathryn Mersmann (USRA)
-
Technical support
- Laurence Schuler (ADNET Systems, Inc.)
- Ian Jones (ADNET Systems, Inc.)
Related papers
Datasets used
-
Sea Ice Concentration (Daily L3 12.5km Tb, Sea Ice Concentration, and Snow Depth) [Aqua: AMSR-E]
ID: 237 -
Winds [MERRA-2]
ID: 959 -
Temperature [Aqua: AIRS]
ID: 960
Note: While we identify the data sets used on this page, we do not store any further details, nor the data sets themselves on our site.
Used as a Source In
- ID: 12421
 Produced Video
Release date
This page was originally published on Thursday, November 10, 2016.
This page was last updated on Sunday, June 23, 2024 at 10:33 PM EDT.