MMS Fly Along with Magnetopause Reconnection
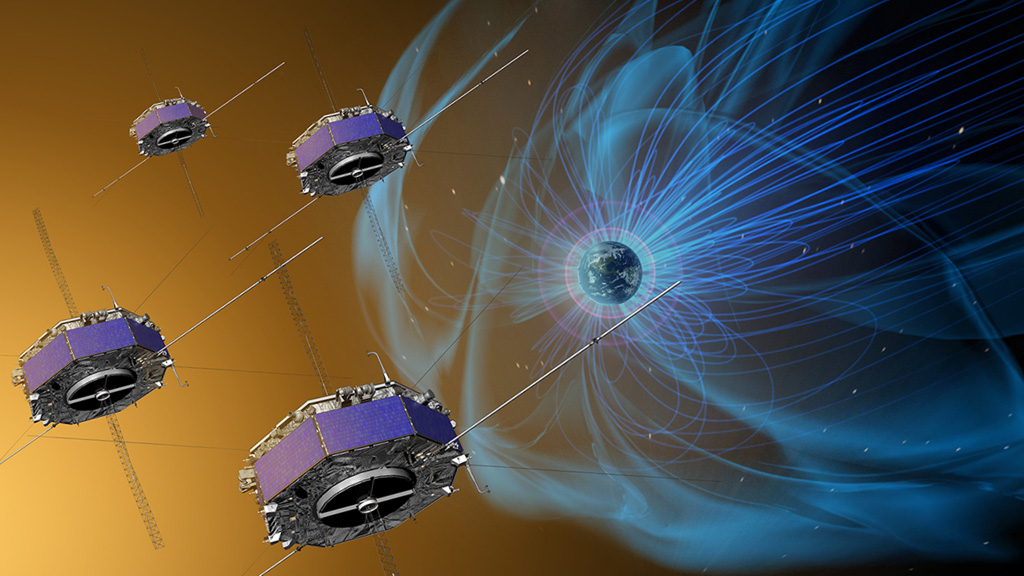
Fly along with MMS satellite configuration with particle and field measurements.
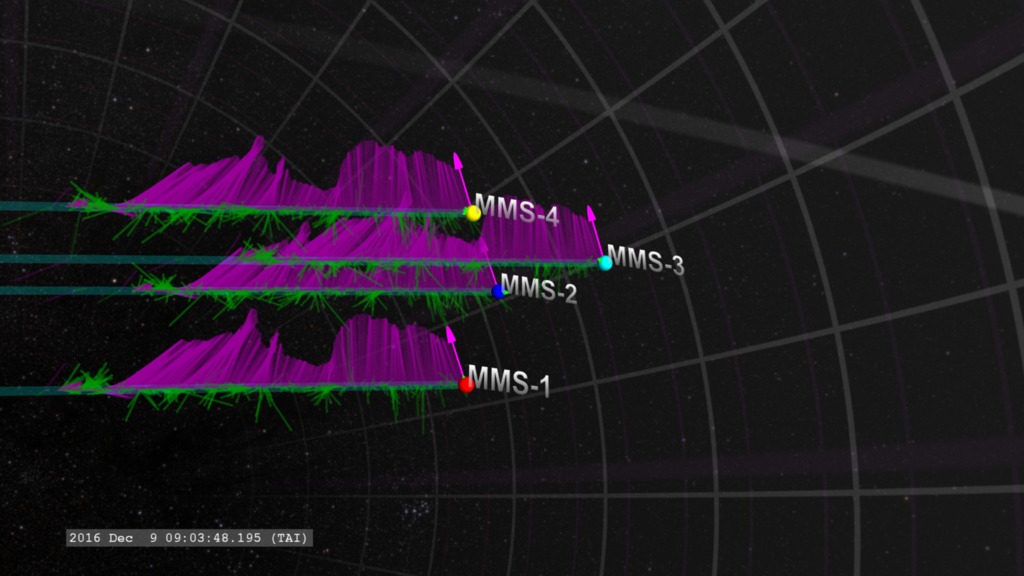
In this data visualization, we fly along with the MMS spacecraft in tetrahedral formation. The mesh structure in the distance is the magnetopause.
Each image frame corresponds to a time step of 30 milliseconds, one of the faster data sampling modes for MMS.
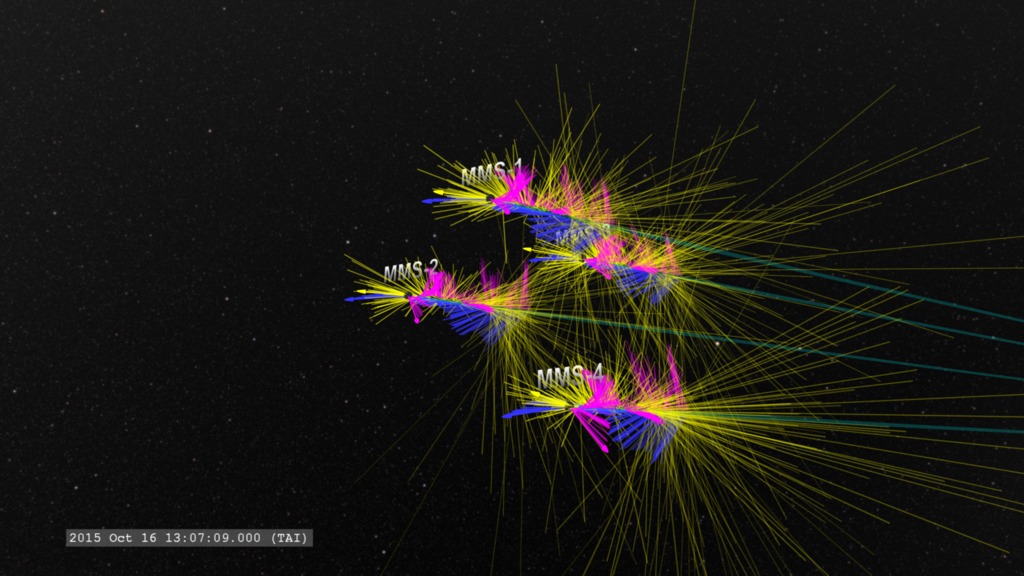
The arrows represent the data collected by the spacecraft. To better comprehend changes as the spacecraft moves along, the data are allowed to 'echo' along the spacecraft trail. The length of the vectors represent the relative magnitude of the vector. However, the electron and proton vectors are scaled so equal velocities correspond to vectors of equal magnitude.
Magenta represents the direction and magnitude of the magnetic field at the spacecraft position. Yellow represents the direction and magnitude of the bulk motion (total average) velocity of the electrons measured at the spacecraft position. Blue represents the direction and magnitude of the bulk motion (total average) velocity of the protons measured at the spacecraft position.
Credits
Please give credit for this item to:
NASA's Scientific Visualization Studio
-
Visualizer
- Tom Bridgman (Global Science and Technology, Inc.)
-
Technical support
- Laurence Schuler (ADNET Systems, Inc.)
- Ian Jones (ADNET Systems, Inc.)
-
Producer
- Genna Duberstein (USRA)
-
Scientists
- Thomas Moore (NASA/GSFC)
- Jim Burch (SwRI)
- Paul Cassak (West Virginia University)
-
Scientific data support
- Steven C. Martin (ADNET Systems, Inc.)
- Daniel J. Gershman (University of Maryland College Park)
Missions
This page is related to the following missions:Series
This page can be found in the following series:Related papers
Datasets used
-
MMS-FIELDS [MMS: FIELDS]
ID: 920 -
MMS-FPI [MMS: Fast Plasma Investigation]
ID: 921
Note: While we identify the data sets used on this page, we do not store any further details, nor the data sets themselves on our site.
Related
- ID: 4639
 Visualization
 - ID: 4453
 Visualization
 - ID: 4460
 Visualization
Used as a Source In
- ID: 12280
 Produced Video
 - ID: 12239
 Produced Video
Release date
This page was originally published on Thursday, May 12, 2016.
This page was last updated on Sunday, January 5, 2025 at 11:02 PM EST.