GMM-3 Mars Gravity Map
Scientists have used small fluctuations in the orbits of three NASA spacecraft to map the gravity field of Mars.
Watch this video on the NASA Goddard YouTube channel.
Complete transcript available.
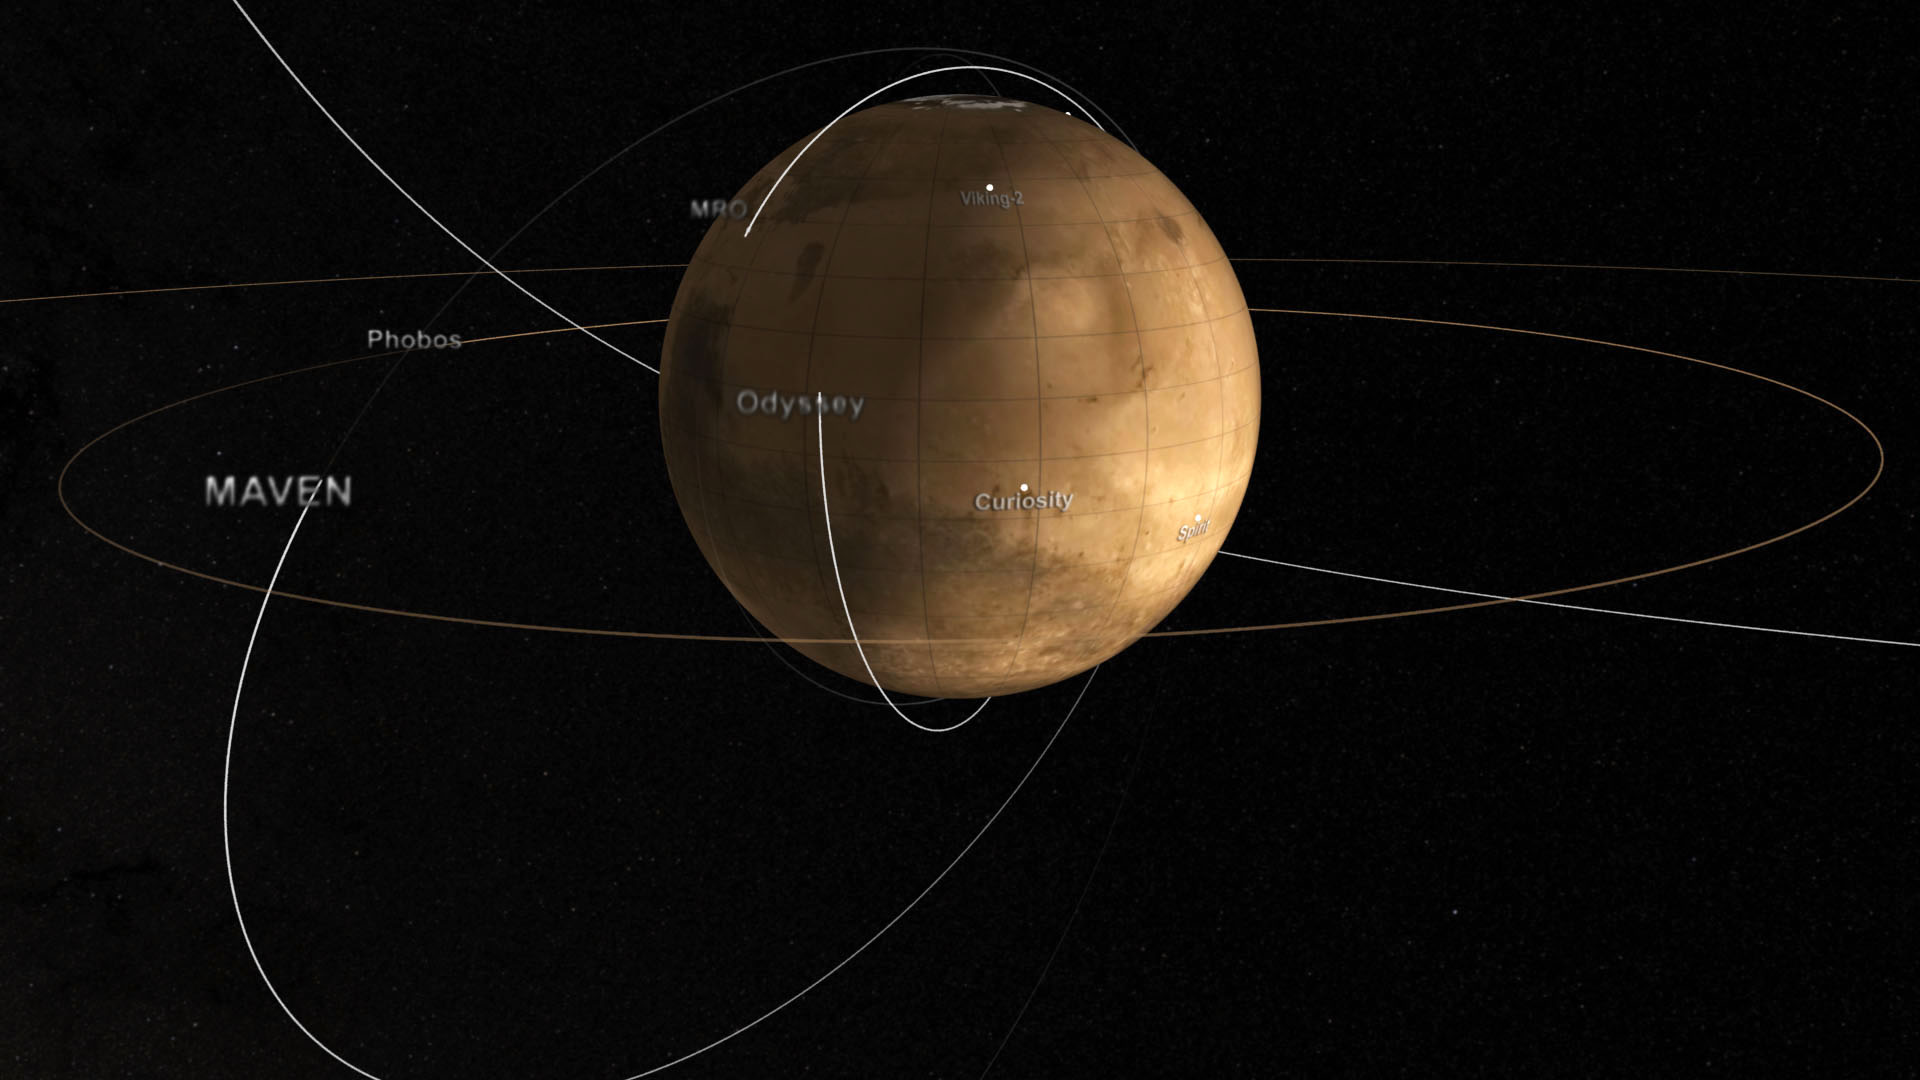
Goddard Mars Model (GMM) 3 is a global map of the gravity field of Mars. It was created by studying the flight paths of three Mars-orbiting spacecraft — Mars Global Surveyor (MGS), Mars Odyssey (ODY), and Mars Reconnaissance Orbiter (MRO).
The travel time and Doppler shift of radio signals sent between the spacecraft and the Earth-based dish antennas of the Deep Space Network are used to measure the position and velocity of each spacecraft. Over time, small variations in these orbital parameters allow scientists to build up an accurate and detailed gravity map of the red planet.
If Mars were a perfectly smooth sphere of uniform density, the gravity experienced by the spacecraft would be exactly the same everywhere. But like other rocky bodies in the solar system, including the Earth, Mars has both a bumpy surface and a lumpy interior. As the spacecraft fly in their orbits, they experience slight variations in gravity caused by both of these irregularities, variations which show up as small changes in the velocity and altitude of the three spacecraft.
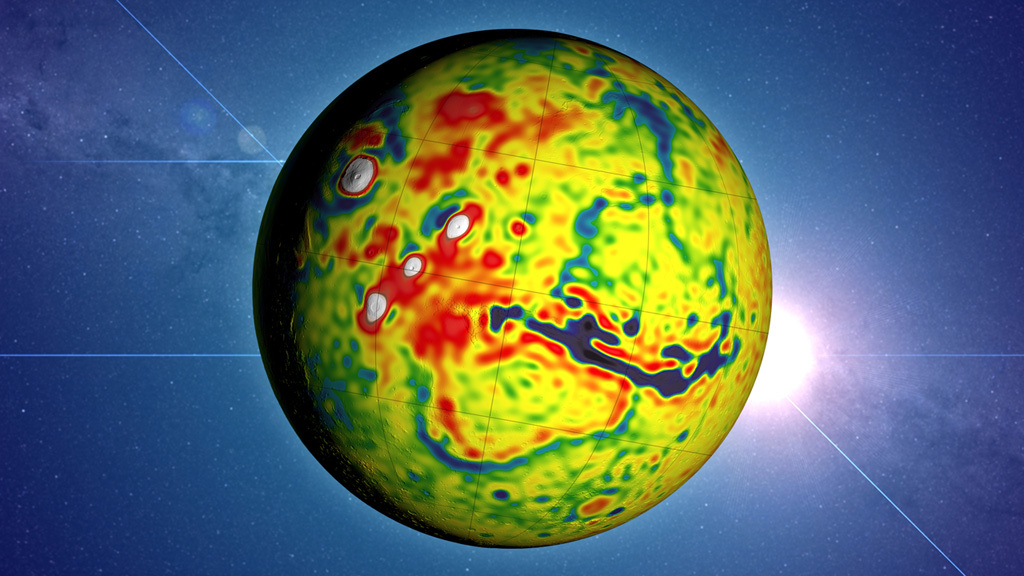
The free-air gravity map shows these variations directly. The map is color-coded to display the departure from the mean gravity of Mars, in milligals, a unit of acceleration. Purple and blue mark areas where the acceleration due to gravity is lower than average, while red and white show where it's higher.
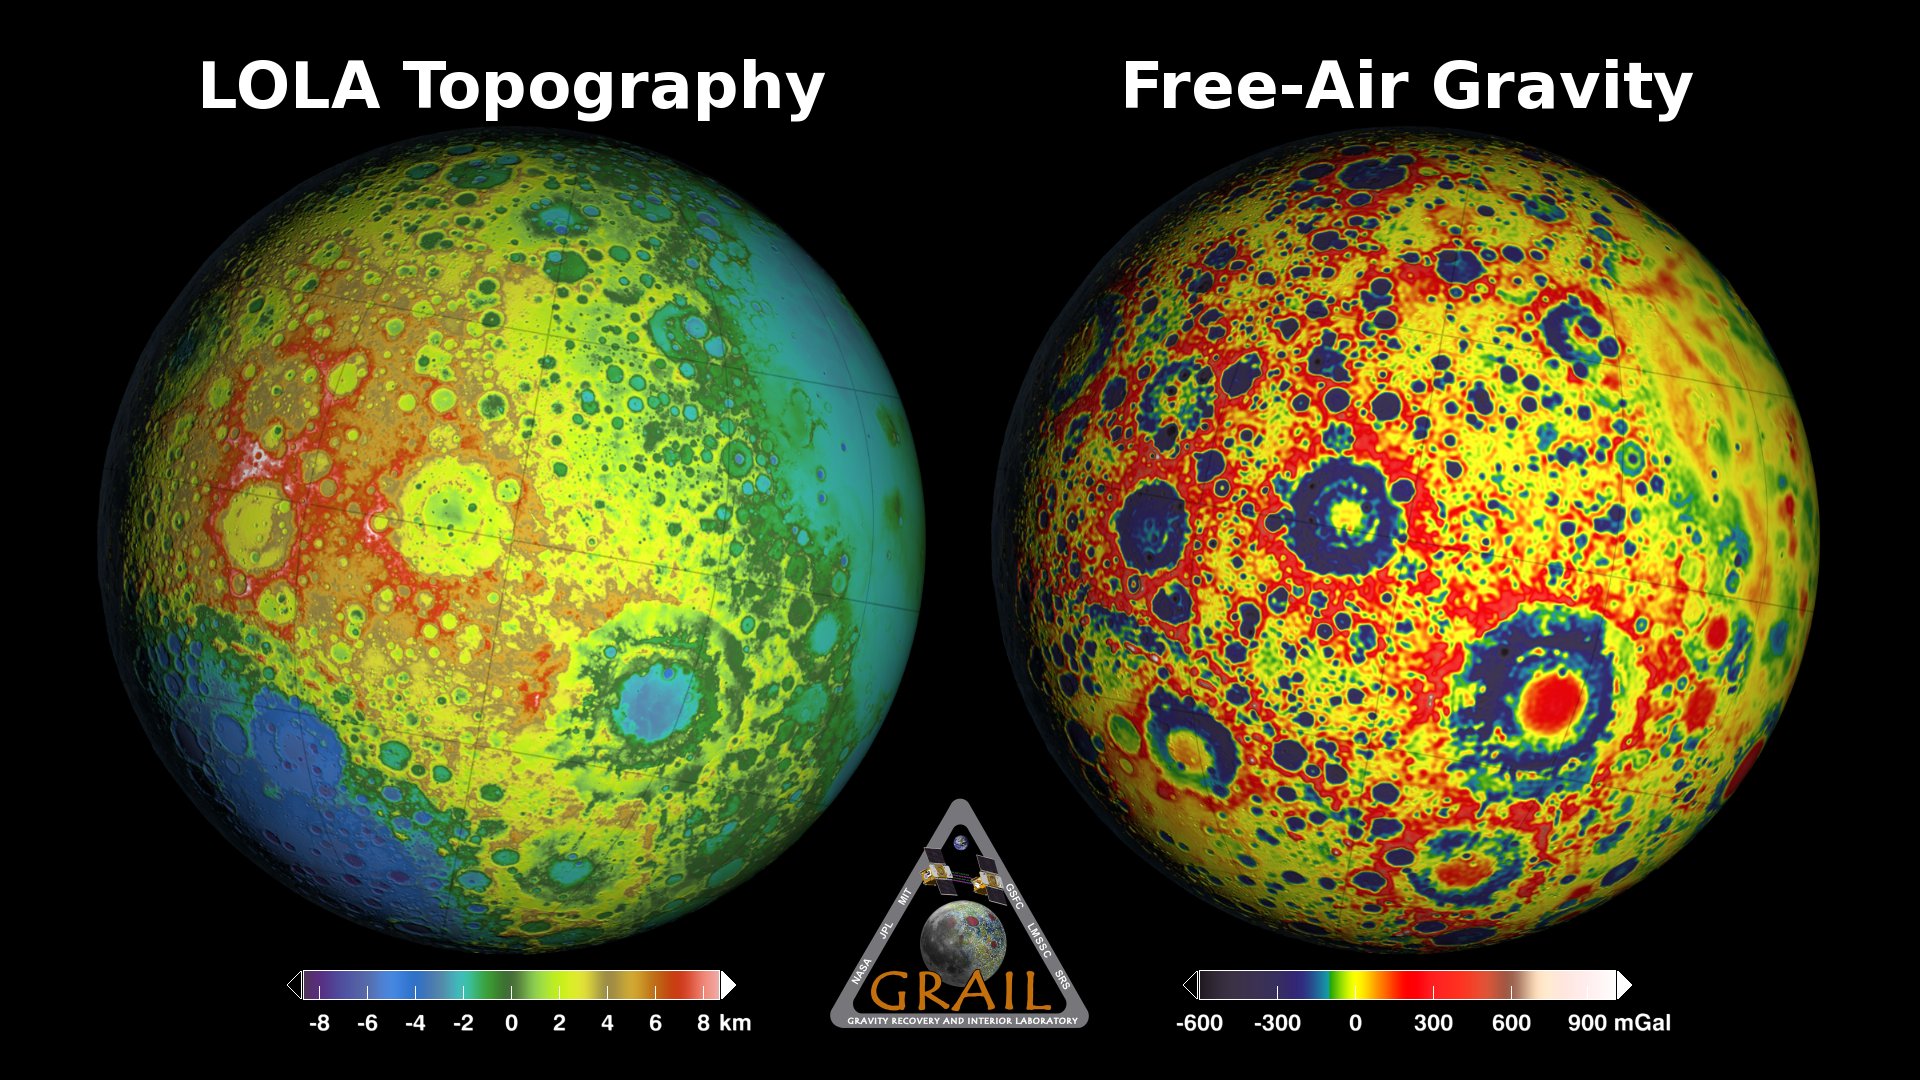
The Bouguer gravity map subtracts the effect of the bumpy surface to show the lumpiness underneath. The elevation maps from the laser altimeter on MGS were used to create a model of what the gravity would be if Mars were bumpy but not lumpy. This model was then subtracted from the free-air map to produce the Bouguer map.
The crustal thickness map is inferred from the Bouguer map: If the density of the crust is assumed to be uniform, then the gravity anomalies visible in the Bouguer gravity map can be explained by variations in the thickness of the crust. Highs in gravity indicate places where the denser mantle is closer to the surface, and hence where the crust is thinner.
The orbit analysis accounted for solar radiation pressure and for the mass and the drag of the thin Martian atmosphere. It also detected the seasonal variation in the amount of carbon dioxide locked up in the polar ice caps as they freeze and thaw.
While aiding navigation for future Mars missions, GMM-3 reveals information about the internal structure of Mars that provides important clues to the geological history of the red planet.
Learn more about the GMM-3 Mars gravity map.
Correction: The surface of the natural-color globe was mapped incorrectly in the initial release of this page. The error was corrected on April 1, 2016.
Side-by-side rotating Mars globes showing MOLA elevation, GMM-3 free-air gravity, and crustal thickness.
Side-by-side rotating Mars globes showing MOLA elevation and GMM-3 free-air gravity.
Side-by-side rotating Mars globes showing GMM-3 Bouguer gravity and crustal thickness.
Rotating Mars globe showing GMM-3 free-air gravity.
Rotating Mars globe showing GMM-3 Bouguer gravity.
Rotating Mars globe showing GMM-3 crustal thickness.
Rotating Mars globe showing MOLA elevation.
Rotating Mars globe showing natural-color
terrain, based on a Mars Global Surveyor camera mosaic.

Print-res still of the Mars elevation, free-air gravity, and crustal thickness globes, centered on 90°W.
Print-res still of the Mars free-air gravity globe, centered at 90°W. Includes an alpha channel.
Print-res still of the Mars crustal thickness globe, centered at 90°W. Includes an alpha channel.
Print-res still of the Mars Bouguer gravity globe, centered at 90°W. Includes an alpha channel.
Print-res still of the Mars MOLA elevations, centered at 90°W. Includes an alpha channel.
Print-res still of the Mars natural-color globe, centered at 90°W. Includes an alpha channel.
Mars free-air gravity map in a cylindrical projection suitable for spherical texture mapping. Centered at 0° longitude. Includes versions with and without shaded relief of surface features.
Mars crustal thickness map in a cylindrical projection suitable for spherical texture mapping. Centered at 0° longitude. Includes versions with and without shaded relief of surface features.
Mars Bouguer gravity map in a cylindrical projection suitable for spherical texture mapping. Centered at 0° longitude. Includes versions with and without shaded relief of surface features.
Mars MOLA elevation map in a cylindrical projection suitable for spherical texture mapping. Centered at 0° longitude. Includes shaded relief of surface features.
For More Information
See NASA.gov
Credits
Please give credit for this item to:
NASA's Scientific Visualization Studio
-
Scientists
- Antonio Genova (Massachusetts Institute of Technology)
- Erwan M. Mazarico (NASA/GSFC)
-
Visualizer
-
Ernie Wright
(USRA)

-
Ernie Wright
(USRA)
-
Producer
- Dan Gallagher (eMITS)
-
Editor
- Dan Gallagher (eMITS)
-
Narrator
- Dan Gallagher (eMITS)
Missions
This page is related to the following missions:Series
This page can be found in the following series:Tapes
The media on this page originally appeared on the following tapes:-
Mars Gravity Map
(ID: 2016003)
Thursday, March 17, 2016 at 4:00AM
Produced by - Dan Jacob (Global Science and Technology, Inc.)
Related papers
A. Genova et al., Seasonal and static gravity field of Mars from MGS, Mars Odyssey and MRO radio science, Icarus, doi: 10.1016/j.icarus.2016.02.050
A. Genova et al., Seasonal and static gravity field of Mars from MGS, Mars Odyssey and MRO radio science, Icarus, doi: 10.1016/j.icarus.2016.02.050
Datasets used
-
[MGS: MOC]
ID: 58 -
GMM-3 (Goddard Mars Model 3)
ID: 916
Note: While we identify the data sets used on this page, we do not store any further details, nor the data sets themselves on our site.
Related
- ID: 4014
 Visualization
Sources
- ID: 4414
 Visualization
Used as a Source In
- ID: 12181
 Produced Video
Release date
This page was originally published on Monday, March 21, 2016.
This page was last updated on Friday, February 27, 2026 at 6:17 PM EST.