IMERG Rainfall Accumulation from December 2015 through February 2016
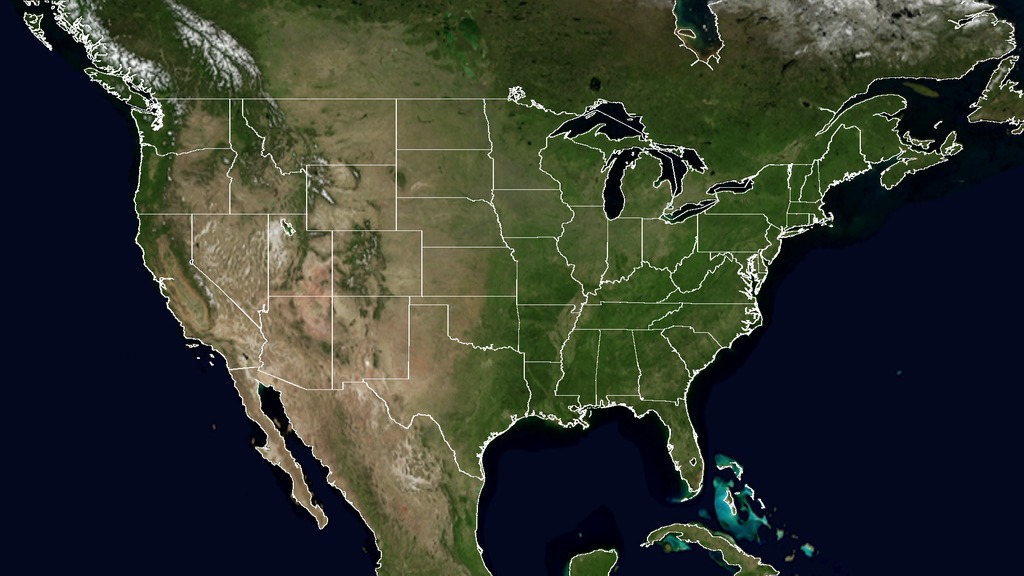
This animation shows the accumulation of rainfall over the United States during December 2015, from the IMERG precipitation dataset.
This animation shows the accumulation of rainfall over the United States during January 2016, from the IMERG precipitation dataset.
This animation shows the accumulation of rainfall over the United States during the period February 1 to 16, 2016, from the IMERG precipitation dataset.
This animation shows the accumulation of rainfall over the western United States during December 2015, from the IMERG precipitation dataset.
This animation shows the accumulation of rainfall over the western United States during January 2016, from the IMERG precipitation dataset.
This animation shows the accumulation of rainfall over the western United States during the period February 1 to 16, 2016, from the IMERG precipitation dataset.

This is the colorbar for rainfall accumulation.
Credits
Please give credit for this item to:
NASA's Scientific Visualization Studio
-
Visualizer
- Horace Mitchell (NASA/GSFC)
-
Scientist
-
George Huffman
(NASA/GSFC)

-
George Huffman
(NASA/GSFC)
Datasets used
-
IMERG
ID: 863This dataset can be found at: http://pmm.nasa.gov/sites/default/files/document_files/IMERG_ATBD_V4.4.pdf
See all pages that use this dataset
Note: While we identify the data sets used on this page, we do not store any further details, nor the data sets themselves on our site.
Related
- ID: 12152
 Produced Video
Used as a Source In
- ID: 12157
 Produced Video
Release date
This page was originally published on Thursday, February 25, 2016.
This page was last updated on Sunday, January 5, 2025 at 10:59 PM EST.