Monthly burned area from the Global Fire Emissions Database (GFED)
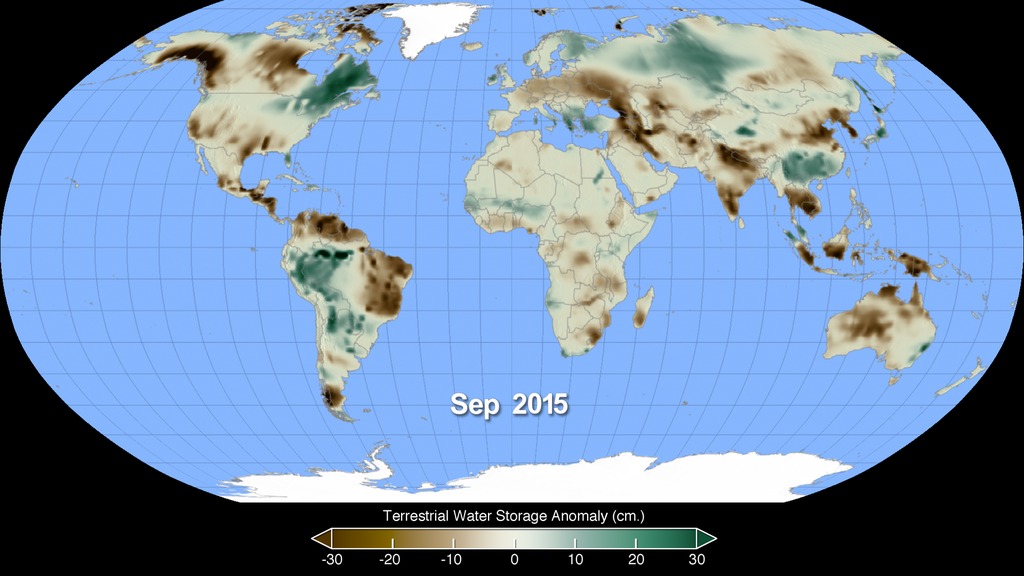
The final animation of the monthly burned area percent shown in the Robinson projection with a colorbar and date overlay
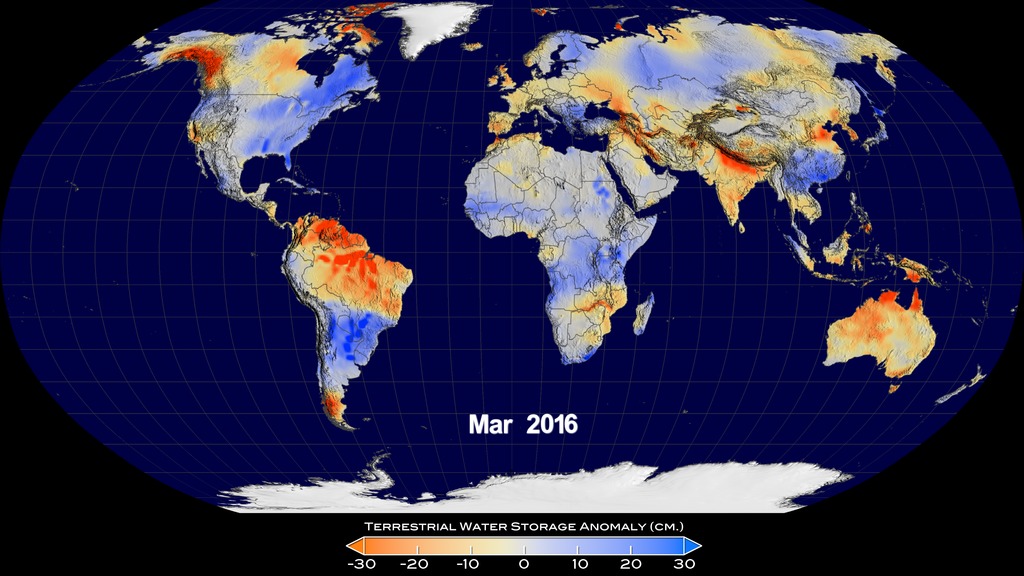
This time series was created using data from the Moderate Resolution Imaging Spectrometer (MODIS) onboard NASA’s Terra and Aqua satellites. Burned area is estimated by applying an algorithm that detects rapid changes in visible and infrared surface reflectance imagery. Fires typically darken the surface in the visible part of the electromagnetic spectrum, and brighten the surface in several wavelength bands in the shortwave infrared that are sensitive to the surface water content of vegetation. Thermal emissions from actively burning fires also are measured by MODIS and are used to improve the burned area estimates in croplands and other areas where the fire sizes are relatively small. This animation portrays burned area between September 2000 and August 2015 as a percent of the 1/4 degree grid cell that was burned each month. The values on the color bar are on a log scale, so the regions shown in blue and green shades indicate small burned areas while those in red and orange represent a larger percent of the region burned. Beneath the burned area, the seasonal Blue Marble landcover shows the advance and retreat of snow in the northern hemisphere. More information about the Global Fire Emissions Database, including maps of burned area and fire emissions, can be found here.

A print resolution still image of the monthly burned area percent shown in the Robinson projection with a colorbar and date overlay
A print resolution still image of the monthly burned area percent shown in the Robinson projection without the colorbar and date

The final animation of the monthly burned area percent shown in the Robinson projection but without the colorbar and date overlay

The corresponding date overlay
 projection")
The original animation in lat/lon (or Platte Carree) projection
The colorbar with transparency
Credits
Please give credit for this item to:
NASA's Scientific Visualization Studio
The Blue Marble Next Generation data is courtesy of Reto Stockli (NASA/GSFC).
-
Visualizer
-
Cindy Starr
(Global Science and Technology, Inc.)

-
Cindy Starr
(Global Science and Technology, Inc.)
-
Scientists
- Jim Randerson (University of California, Irvine)
- Yang Chen (University of California, Irvine)
-
Doug C. Morton
(NASA/GSFC)
-
Project support
- Joycelyn Thomson Jones (NASA/GSFC)
- Eric Sokolowsky (Global Science and Technology, Inc.)
- Leann Johnson (Global Science and Technology, Inc.)
-
Technical support
- Laurence Schuler (ADNET Systems, Inc.)
- Ian Jones (ADNET Systems, Inc.)
-
Producers
- Ellen T. Gray (ADNET Systems, Inc.)
- Kayvon Sharghi (USRA)
Datasets used
-
BMNG (Blue Marble: Next Generation) [Terra and Aqua: MODIS]
ID: 508Credit: The Blue Marble data is courtesy of Reto Stockli (NASA/GSFC).
This dataset can be found at: http://earthobservatory.nasa.gov/Newsroom/BlueMarble/
See all pages that use this dataset -
Percent Monthly Burned Area [MODIS: Terra/Aqua]
ID: 908
Note: While we identify the data sets used on this page, we do not store any further details, nor the data sets themselves on our site.
Related
- ID: 4476
- ID: 4413
- ID: 4415
 Visualization
 - ID: 12095
 Produced Video
Release date
This page was originally published on Tuesday, December 15, 2015.
This page was last updated on Sunday, January 5, 2025 at 12:06 AM EST.