A newer version of this visualization is available.
NASA Earth Observing Fleet (February 2015)
A newer version of this visualization can be found here.
Orbital Fleet including SMAP without TRMM
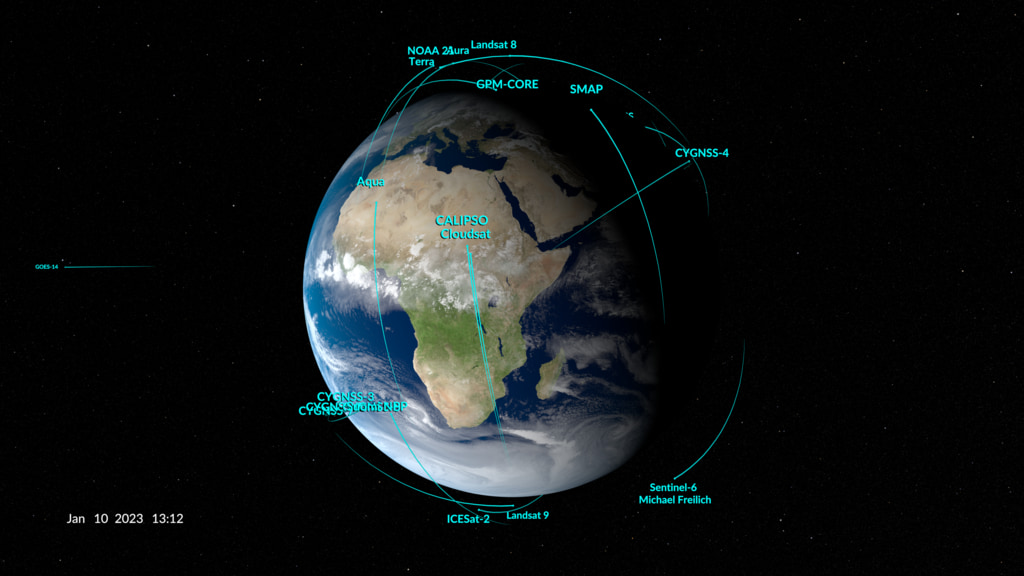
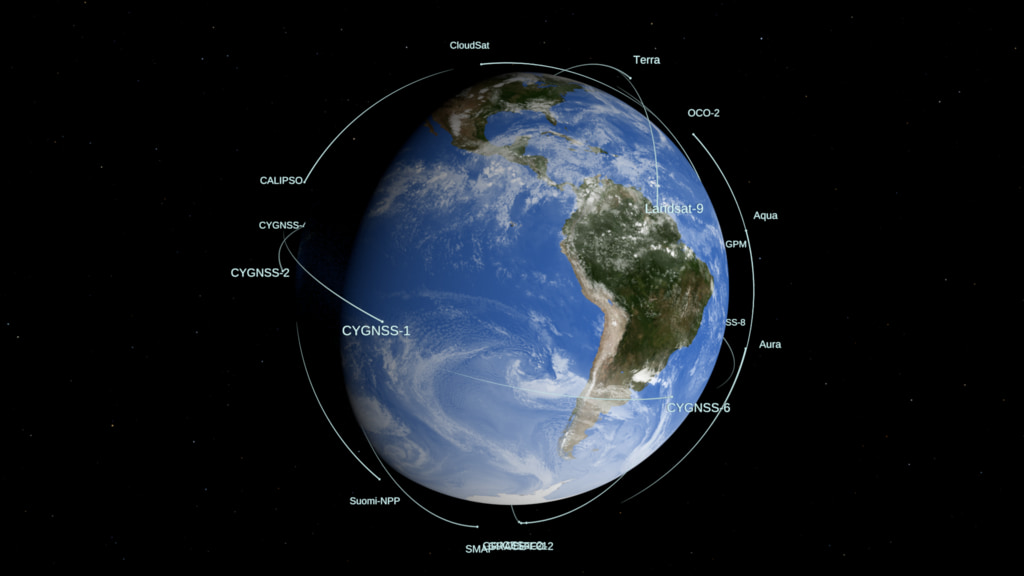
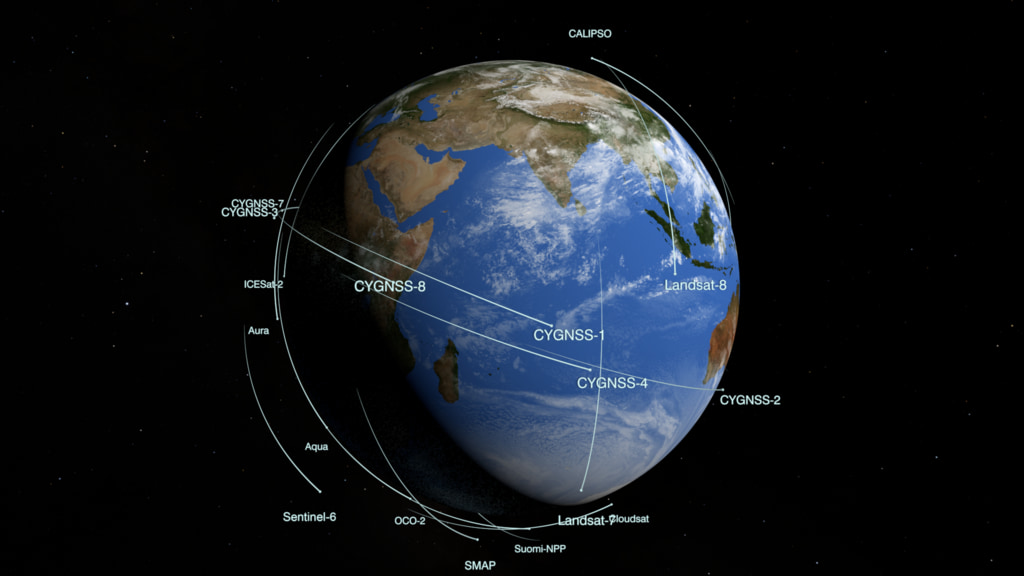
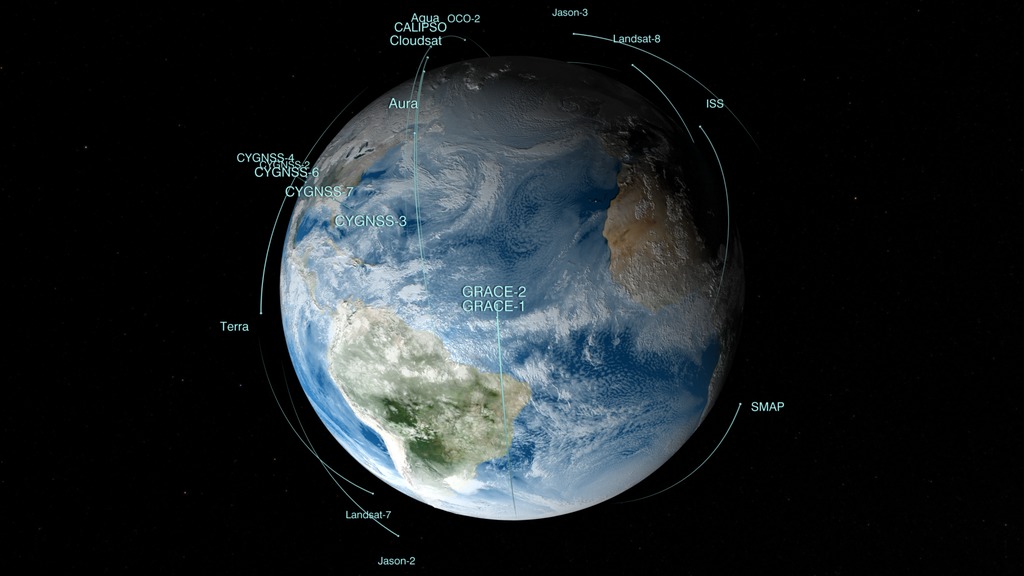
This animation shows the orbits of NASA's fleet of Earth remote sensing observatories as of February 2015.
The satellites include components of the A-Train:
Recently launched missions:the International Space Station
and eleven others:
These satellites measure rainfall, solar irradiance, clouds, sea surface height, ocean salinity, and other aspects of the global environment. Together, they provide a picture of the Earth as a system.
This is an update of entry 4208. This update includes a version created for display on the NASA Center for Climate Simulation (NCCS) hyperwall, a 5 x 3 array of high-definition displays with a total pixel resolution of 9600 x 3240. The orbits are based on orbital elements with epochs on February 10, 2015. The date shown in the animation is 2015 Februrary 16 with times from 00:00:00 GMT to 12:00:00 GMT.
There are two other versions: without TRMM; and without TRMM or EO-1.
Orbital fleet including SMAP, TRMM, and EO-1
This video is also available on our YouTube channel.
Orbital fleet including SMAP, but without TRMM or EO-1
Credits
Please give credit for this item to:
NASA/Goddard Space Flight Center Scientific Visualization Studio
-
Animators
-
Greg Shirah
(NASA/GSFC)

-
Ernie Wright
(USRA)
-
Kel Elkins
(USRA)
-
Greg Shirah
(NASA/GSFC)
-
Project support
- Eric Sokolowsky (Global Science and Technology, Inc.)
Missions
This page is related to the following missions:Datasets used
-
CelesTrak Spacecraft Orbit Ephemeris
ID: 454This dataset can be found at: http://celestrak.com
See all pages that use this dataset -
BMNG (Blue Marble: Next Generation) [Terra and Aqua: MODIS]
ID: 508Credit: The Blue Marble data is courtesy of Reto Stockli (NASA/GSFC).
This dataset can be found at: http://earthobservatory.nasa.gov/Newsroom/BlueMarble/
See all pages that use this dataset -
GEOS-5 Cubed-Sphere (GEOS-5 Atmospheric Model on the Cubed-Sphere)
ID: 663The model is the GEOS-5 atmospheric model on the cubed-sphere, run at 14-km global resolution for 30-days. GEOS-5 is described here http://gmao.gsfc.nasa.gov/systems/geos5/ and the cubed-sphere work is described here http://sivo.gsfc.nasa.gov/cubedsphere_overview.html.
See all pages that use this dataset
Note: While we identify the data sets used on this page, we do not store any further details, nor the data sets themselves on our site.
Related
- ID: 12178
 Produced Video
 - ID: 11976
 Produced Video
Newer Versions
- ID: 5061
 Visualization
 - ID: 4928
 Visualization
 - ID: 4931
 Visualization
 - ID: 4558
 Visualization
Used as a Source In
- ID: 11812
 Produced Video
Release date
This page was originally published on Thursday, February 26, 2015.
This page was last updated on Sunday, February 2, 2025 at 10:20 PM EST.