Landsat-8 Long Arctic Swath
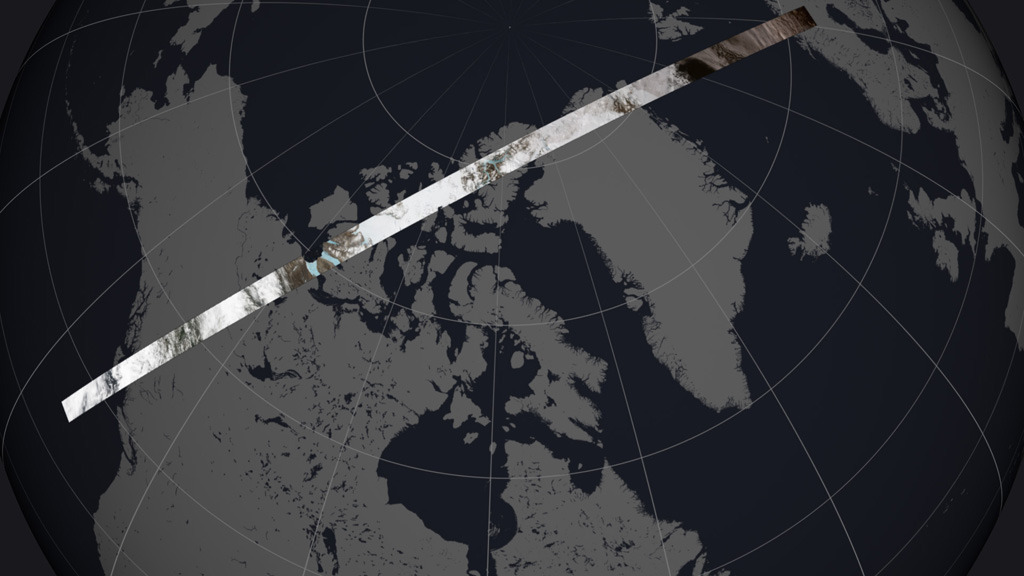
Landsat 8 observed this arctic swath of data on June 21, 2014. This section captures Victoria Island, the boundary between the Nunavut and the Northwest Territories of Canada, and the Amundsen Gulf. The Prince Albert Sound and the Dolphin and Union Strait are still ice covered.
On June 21, 2014 - the summer solstice - when the Suns stays above the horizon of the Arctic for at least 24 hours, Landsat 8 acquired this unbroken swath of images. While much of the region is still frozen in June, the ice is in various stages of melting.
The Landsat 8 swath begins in Sweden and Finland, then crosses the Greenland Sea and Northern Greenland. The scenes then take us over North America, through Canada's Nunavut and Northwest Territories, before ending up offshore of British Columbia. In its entirety, the flyover is composed of 52 individual Landsat scenes and covers an area about 6,800 kilometers wide (4200 by 120 miles).
"These Landsat swaths provide stunning views of transitions across the most infrequently visited areas of our planet," said Jim Irons, NASA's project scientist for Landsat 8.
The full swaths offer a unique perspective by showing Earth as the satellite "sees" it on its orbital path. And like the view from a cross-country flight on an airplane, there are often clouds blocking the view of the ground.
"When you add the multi-temporal and historic nature of the Landsat data archive into consideration," Irons said, "the views become vital in observing seasonal and interannual changes to a region that is most sensitive to climate change."
This 10 second data visualization shows the full arctic swath taken on June 21, 2014.
Credits
Please give credit for this item to:
NASA's Goddard Space Flight Center Scientific Visualization Studio
-
Animators
- Lori Perkins (NASA/GSFC)
-
Greg Shirah
(NASA/GSFC)

-
Data visualizer
- Lori Perkins (NASA/GSFC)
-
Producer
- Matthew R. Radcliff (USRA)
-
Writer
- Matthew R. Radcliff (USRA)
-
Scientist
- James R. Irons (NASA/GSFC)
Missions
This page is related to the following missions:Datasets used
-
True Color (Band Combination 2,3,4) [Landsat-8: OLI]
ID: 784
Note: While we identify the data sets used on this page, we do not store any further details, nor the data sets themselves on our site.
Related
- ID: 11752
 Produced Video
Used as a Source In
- ID: 11779
![The Operational Land Imager (OLI) on Landsat 8 acquired this unbroken swath of images on June 21, 2014—the summer solstice—when the Sun stays above the horizon of the Arctic for at least 24 hours. While much of the region is still frozen in June, the ice is in various stages of melting.For complete transcript, click here.Watch this video on the NASA Earth Observatory YouTube channel.Music: Thin Ice Mining by Chris Constantinou [PRS], Paul Frazer [PRS] Melting Glacier by Chris Constantinou [PRS], Paul Frazer [PRS] Undiscovered Oceans by Aaron Yeddidia [BMI], Chris Lang [BMI], Eric Cunningham [BMI] Another Sleep by Chris Constantinou [PRS], Paul Frazer [PRS]](/vis/a010000/a011700/a011779/G2015-015_Arctic_Swath_MASTER_youtube_hq_print.jpg) Produced Video
Produced Video
Release date
This page was originally published on Monday, February 16, 2015.
This page was last updated on Wednesday, May 3, 2023 at 1:49 PM EDT.