Megadroughts in U.S. West Projected to be Worst of the Millennium
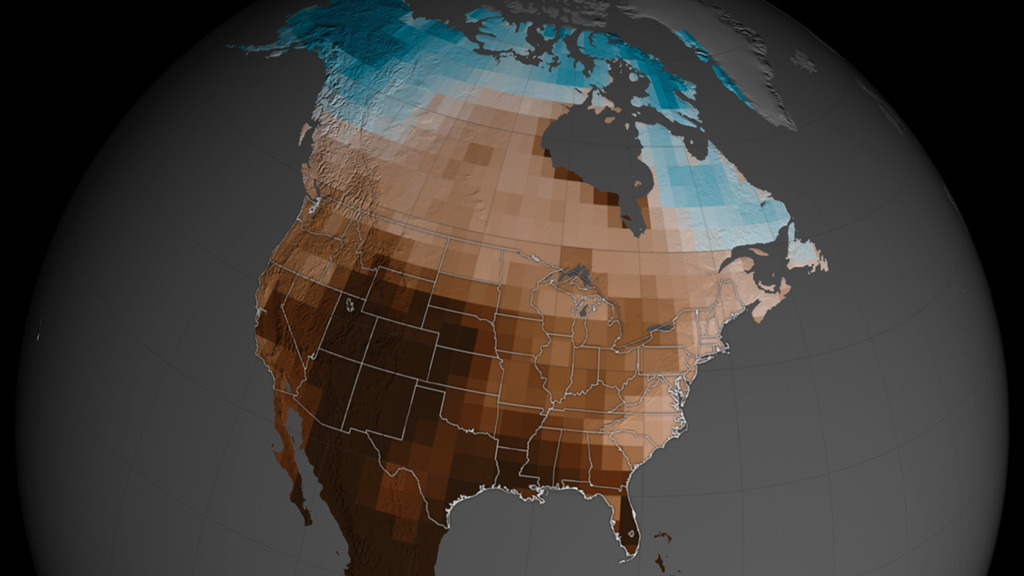
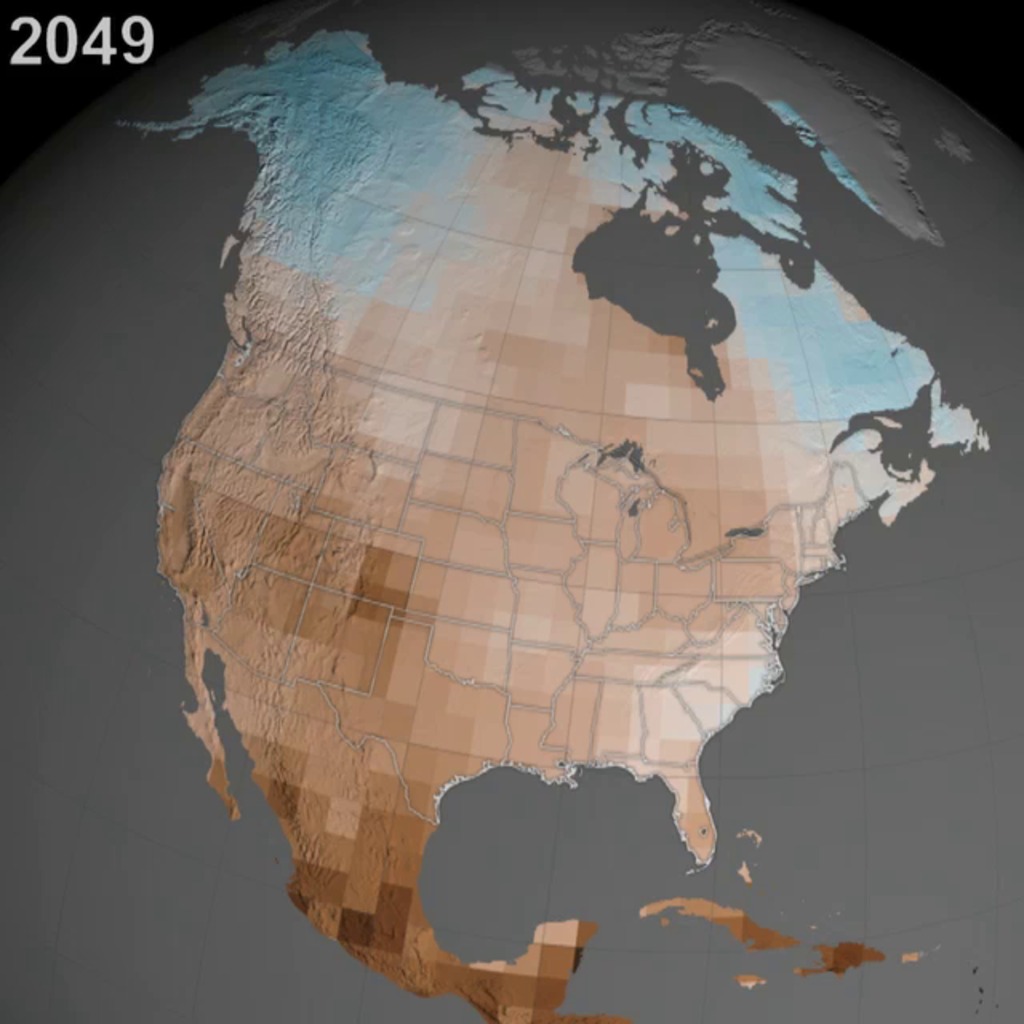
Soil moisture (surface down to 30cm) from 1950 to 2095 based on a 10 year moving average of 17 CMIP5 models using a high future emissions scenario (RCP 8.5). The year shown is the middle of the 10-year moving average.
This video is also available on our YouTube channel.
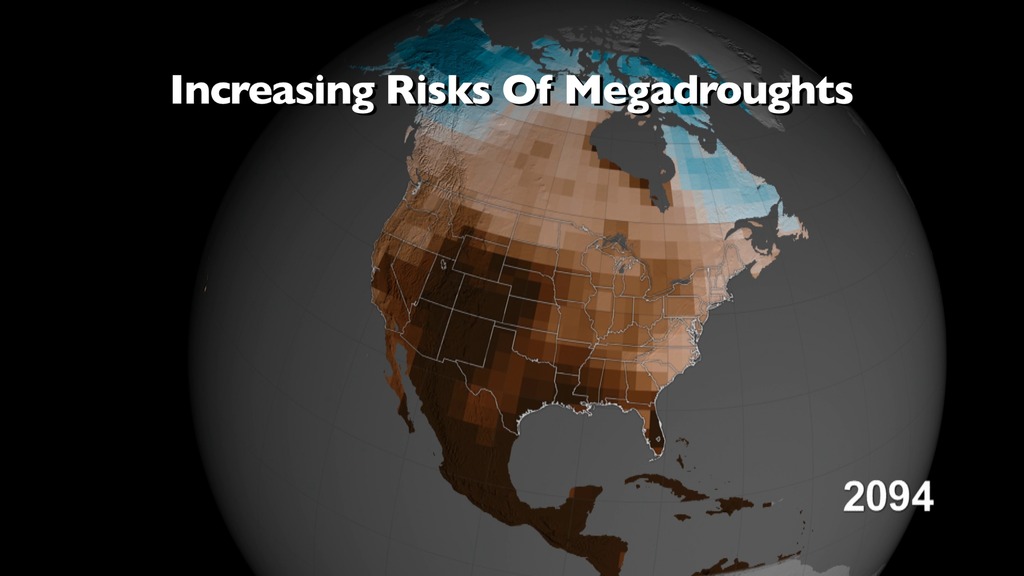
Droughts in the Southwest and Central Plains of the United States in the second half of the 21st century could be drier and longer than anything humans have seen in those regions in the last 1,000 years, according to a new NASA study published in Science Advances on Feb 12, 2015. The research found continued increases in human-produced greenhouse gas emissions drives up the risk of severe droughts in these regions.
"Natural droughts like the 1930s Dust Bowl and the current drought in the Southwest have historically lasted maybe a decade or a little less," said Ben Cook, climate scientist at NASA's Goddard Institute for Space Studies and the Lamont-Doherty Earth Observatory at Columbia University in New York City, and lead author of the study. "What these results are saying is we're going to get a drought similar to those events, but it is probably going to last at least 30 to 35 years."
According to Cook, the current likelihood of a megadrought, a drought lasting more than three decades, is 12 percent. If greenhouse gas emissions stop increasing in the mid-21st century, as in a climate scenario called RCP 4.5, Cook and his colleagues project the likelihood of megadrought to reach more than 60 percent. However, if greenhouse gas emissions continue to increase along current trajectories throughout the 21st century, climate scenario RCP 8.5, there is an 80 percent likelihood of a decades-long megadrought in the Southwest and Central Plains between the years 2050 and 2099.
The scientists analyzed a drought severity index and two soil moisture data sets from 17 climate models that were run for both emissions scenarios. The high emissions scenario projects the equivalent of an atmospheric carbon dioxide concentration of 1,370 parts per million (ppm) by 2100, while the moderate emissions scenario projects the equivalent of 650 ppm by 2100. Currently, the atmosphere contains 400 ppm of CO2.
Soil moisture (surface down to 30cm) from 1950 to 2095 based on a 10 year moving average of 17 CMIP5 models using a moderate future emissions scenario (RCP 4.5). The year shown is the middle of the 10-year moving average.
 color bar. Browns indicate lower soil moisture regions, blues indicate higher soil moisture regions.")
Soil moisture balance (surface down to 30 cm) color bar. Browns indicate lower soil moisture regions, blues indicate higher soil moisture regions.
Print resolution still of 2090->2099 average with the RCP8.5 scenario
Print resolution still of 2090->2099 average with the RCP4.5 scenario
Print resolution still of 2090->2099 average with the RCP8.5 scenario (flat map; lon: [-180, -50] and lat: [9.5, 74.5] )
Print resolution still of 2090->2099 average with the RCP4.5 scenario (flat map; lon: [-180, -50] and lat: [9.5, 74.5] )
Credits
Please give credit for this item to:
NASA's Scientific Visualization Studio
-
Animators
-
Greg Shirah
(NASA/GSFC)

- Cheng Zhang (USRA)
-
Greg Shirah
(NASA/GSFC)
-
Producer
- Jefferson Beck (USRA)
-
Writer
- Ellen T. Gray (ADNET Systems, Inc.)
-
Scientists
- Benjamin I. Cook (NASA/GSFC GISS)
- Toby R. Ault (Earth and Atmospheric Sciences, Cornell University)
- Jason E. Smerdon (Ocean and Climate Physics, Lamont-Doherty Earth Observatory)
-
Project support
- Eric Sokolowsky (Global Science and Technology, Inc.)
Datasets used
-
CMIP5 (Coupled Model Intercomparison Project Phase 5)
ID: 797
Note: While we identify the data sets used on this page, we do not store any further details, nor the data sets themselves on our site.
Related
- ID: 11753
 Produced Video
 - ID: 11772
 Produced Video
 - ID: 11773
- ID: 11776
 Produced Video
Used as a Source In
- ID: 13253
 Produced Video
Release date
This page was originally published on Thursday, February 12, 2015.
This page was last updated on Wednesday, October 9, 2024 at 12:04 AM EDT.