Greenland Ice Sheet Stratigraphy
The above movie shows the new 3D map of the age of the Greenland ice sheet, using a collage of live footage and animation to explain how scientists determined the age from data collected by ice-penetrating radar.
The full script of the narration is available here.
This video is also available on our YouTube channel.
For nearly a century, scientists have been studying the form and flow of the Greenland Ice Sheet. They have measured the change in the elevation of the surface over time using satellites. They have drilled ice cores in the field to reveal a record of what the past climate was like. They have flown aircraft over the surface of the ice sheet laden with instruments to gleen information about the interior of the ice sheet and the bedrock below.
Now a new analysis of this data has revealed a three dimensional map of the age of the ice sheet. This visualization shows this new 3D age map of the Greenland Ice Sheet, explains how it was created and describes the three distinct periods of climate that are evident within the ice sheet.
More information is available here.
The original animated frames for the introduction to the movie, running from the beginning of the movie to time code 00:00:25 when the live-action portion begins.
The original animated frames for the second half on the movie, beginning after the live-action ends at time code 00:01:06 and running through the end of the movie.
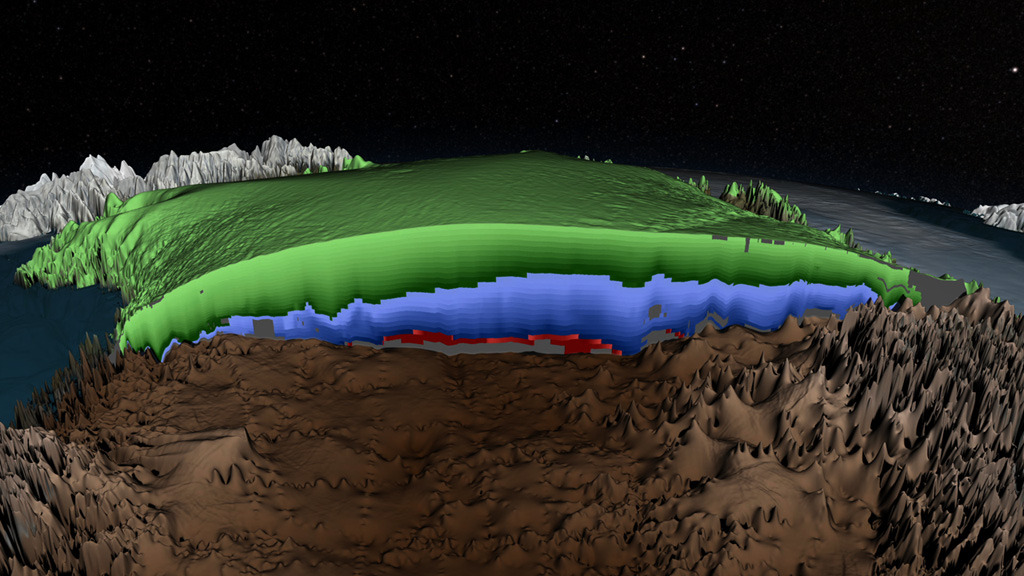
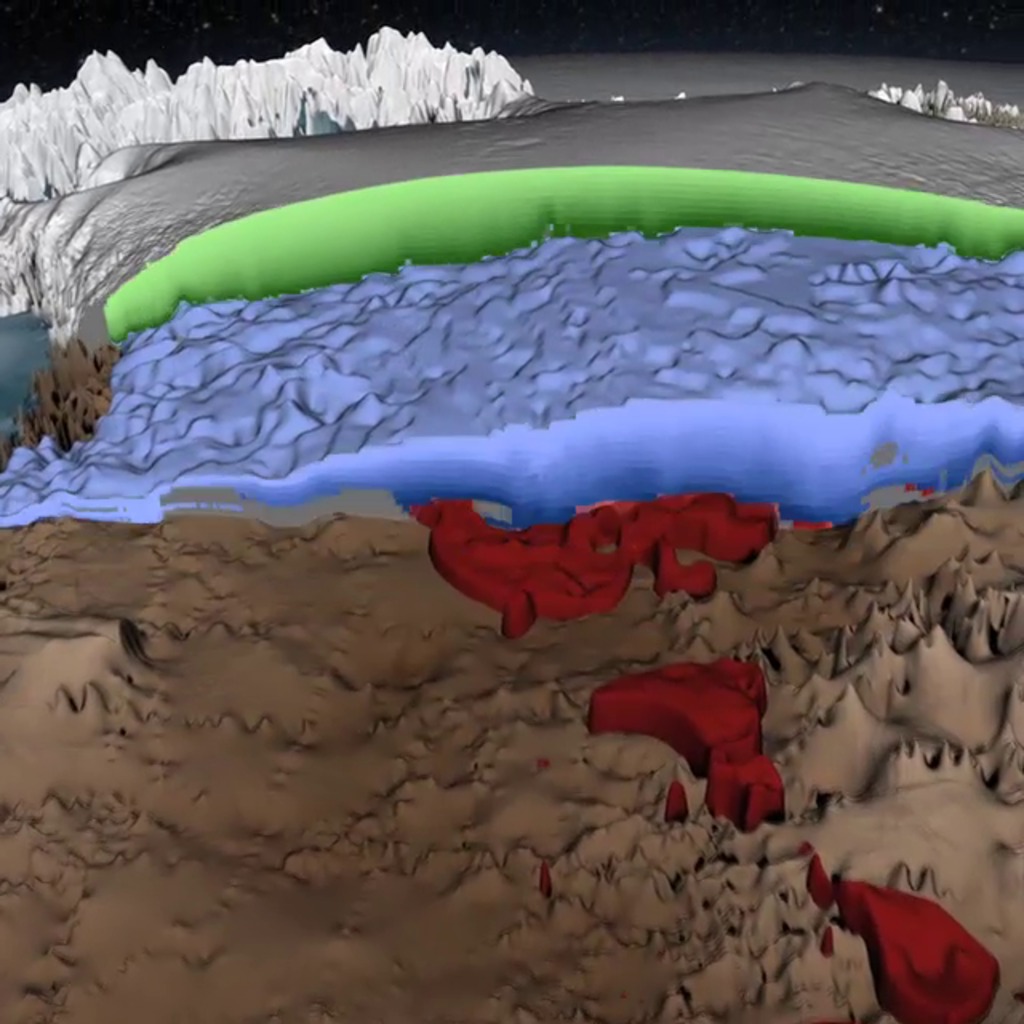
 Layers determined to be from the Holocene period, formed during the past 11.7 thousand years, are shown in Green. Age layers accumulated during the last ice age, from 11.7 to 115 thousand years ago are shown in blue. Age layers from the Eemian period, more than 115 thousand years old are shown in red. Regions of unknown age are filled with a flat gray colour.")
This print resolution image shows one cross-section of the age of the Greenland Ice Sheet as determined by MacGregor et al. (See citation under the "More Details..." button below) Layers determined to be from the Holocene period, formed during the past 11.7 thousand years, are shown in Green. Age layers accumulated during the last ice age, from 11.7 to 115 thousand years ago are shown in blue. Age layers from the Eemian period, more than 115 thousand years old are shown in red. Regions of unknown age are filled with a flat gray colour.
This print resolution still image shows the layers in radargram data collected by one flight made by Operation IceBridge across the Greenland Ice Sheet on May 2, 2011.
This image shows the layers from radargram data that were collected by an Operation Ice Bridge flight over the Greenland ice sheet on May 2, 2011. An overlay of colored lines traced along layers indicates the age of individual layers across the ice sheet. The age layers are colored by the period colour, with Holocene layers shown in green and those from the last ice age shown in blue. Labels indicate the age of various layers. The 1966 Camp Century ice core is shown on the left.
This print resolution still image shows the flight lines where aircraft have flown over the surface of Greenland collecting data on the ice sheet. Lavender lines indicate flights flown by Operation IceBridge while gray lines indicate prior flights.
For More Information
Credits
Please give credit for this item to:
NASA's Scientific Visualization Studio
-
Visualizer
-
Cindy Starr
(Global Science and Technology, Inc.)

-
Cindy Starr
(Global Science and Technology, Inc.)
-
Animator
-
Greg Shirah
(NASA/GSFC)
-
Greg Shirah
(NASA/GSFC)
-
Video editors
- Jefferson Beck (USRA)
-
Cindy Starr
(Global Science and Technology, Inc.)
- Stuart A. Snodgrass (HTSI)
-
Narration
- Joe MacGregor (University of Texas)
- Jefferson Beck (USRA)
- Mark Fahnestock (University of Alaska)
-
Cindy Starr
(Global Science and Technology, Inc.)
-
Narrator
- Jefferson Beck (USRA)
-
Producer
- Jefferson Beck (USRA)
-
Scientists
- Joe MacGregor (University of Texas)
- Mark Fahnestock (University of Alaska)
-
Project support
- Laurence Schuler (ADNET Systems, Inc.)
- Ian Jones (ADNET Systems, Inc.)
Related papers
MacGregor, J.A., M.A. Fahnestock, G.A. Catania, J.D. Paden, S. Gogineni, S.K. Young, S.C. Rybarski, A.N. Mabrey, B.M. Wagman and M. Morlighem, Radiostratigraphy and age structure of the Greenland Ice Sheet, J. Geophys. Res. Earth Surface, 2015, doi: 10.1002/2014JF003215
( http://onlinelibrary.wiley.com/doi/10.1002/2014JF003215/abstract ).
M. Morlighem, E. Rignot, J. Mouginot, H. Seroussi and E. Larour, Deeply incised submarine glacial valleys beneath the Greenland Ice Sheet, Nat. Geosci., 7, 418-422, 2014, doi:10.1038/ngeo2167
( http://www.nature.com/ngeo/journal/vaop/ncurrent/full/ngeo2167.html ).
Datasets used
-
BMNG (Blue Marble: Next Generation) [Terra and Aqua: MODIS]
ID: 508Credit: The Blue Marble data is courtesy of Reto Stockli (NASA/GSFC).
This dataset can be found at: http://earthobservatory.nasa.gov/Newsroom/BlueMarble/
See all pages that use this dataset -
10 km Daily Sea Ice Concentration [SHIZUKU (GCOM-W1): AMSR2]
ID: 795Credit: AMSR2 data courtesy of the Japan Aerospace Exploration Agency (JAXA).
See all pages that use this dataset -
10 km Daily 89 GHz Brightness Temperature [SHIZUKU (GCOM-W1): AMSR2]
ID: 796Credit: AMSR2 data courtesy of the Japan Aerospace Exploration Agency (JAXA).
See all pages that use this dataset -
Operation IceBridge Flight Paths [Aircraft]
ID: 850 -
Pre-IceBridge Flight Paths [Aircraft]
ID: 851 -
Greenland Ice Sheet Inferred 3-D Age Volume
ID: 852 -
Greenland Mass Conservation Dataset - Surface Elevation
ID: 853This dataset can be found at: http://sites.uci.edu/morlighem/dataproducts/mass-conservation-dataset/
See all pages that use this dataset -
Greenland Mass Conservation Dataset - Bed Topography
ID: 854This dataset can be found at: http://sites.uci.edu/morlighem/dataproducts/mass-conservation-dataset/
See all pages that use this dataset -
Greenland Mass Conservation Dataset - Ice Thickness
ID: 855This dataset can be found at: http://sites.uci.edu/morlighem/dataproducts/mass-conservation-dataset/
See all pages that use this dataset -
L1B Geolocated Radar Echo Strength Profiles, Version 2 [IceBridge: MCoRDS]
ID: 857This dataset can be found at: http://nsidc.org/data/irmcr1b#expandMajorVersionSummary
See all pages that use this dataset -
MODIS Mosaic of Greenland (MOG) Image Map [Terra: MODIS]
ID: 858
Note: While we identify the data sets used on this page, we do not store any further details, nor the data sets themselves on our site.
Related
- ID: 11736
 Produced Video
 - ID: 11740
 Produced Video
Release date
This page was originally published on Friday, January 23, 2015.
This page was last updated on Sunday, January 5, 2025 at 10:41 PM EST.