Volume-Rendered Global Atmospheric Model
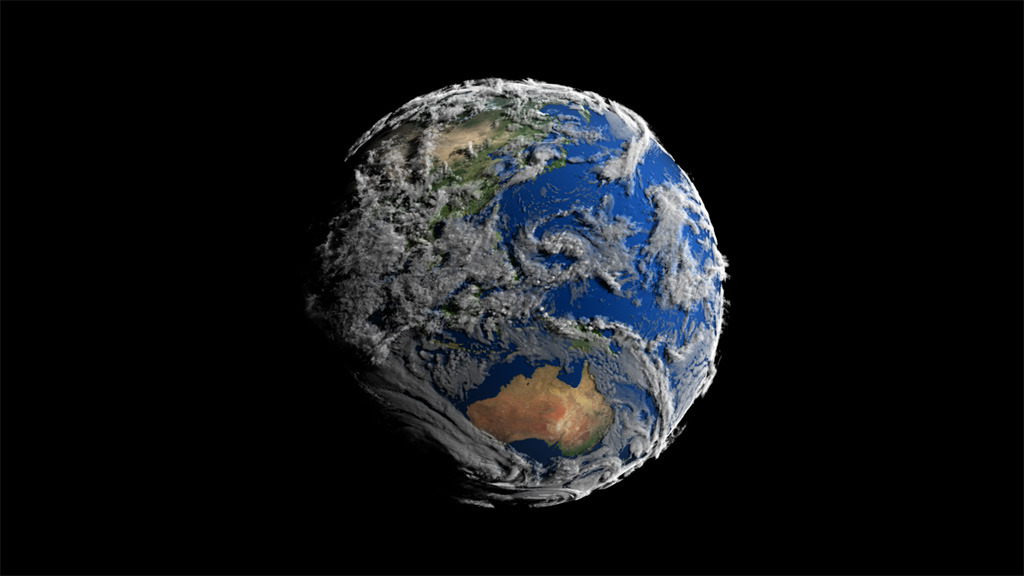
This visualization shows early test renderings of a global computational model of Earth's atmosphere based on data from NASA's Goddard Earth Observing System Model, Version 5 (GEOS-5). This particular run, called 7km GEOS-5 Nature Run (7km-G5NR), was run on a supercomputer, spanned 2 years of simulation time at 30 minute intervals, and produced petabytes of output. The model uses a 7.5 km cube-sphere parameterization. Geographic coordinate output volumes from the model are 5760 x 2881 x 72 voxels per time step. For each voxel numerous physical parameters are available such as temperature, wind speed and direction, pressure, humidity, etc. This visualziation uses a combination of the CLOUD and TAUIR parameters.
The visualization spans a little more than 7 days of simulation time which is 354 time steps. The time period was chosen because a simulated category-4 typhoon developed off the coast of China. The frames were rendered using Renderman. Brickmap volumes generated for each time step are about 2.6 gigabytes. This short visualization referenced nearly a terabyte of brickmap files. The 7 day period is repeated several times during the course of the visualization.
This visualization was presented at SIGGRAPH 2014 during the Dailies session.
Clouds and TAUIR from the 7km GEOS-5 Nature Run (7km-G5NR)
For complete transcript, click here.
This video is also available on our YouTube channel.
Credits
Please give credit for this item to:
NASA's Scientific Visualization Studio
-
Animators
-
Greg Shirah
(NASA/GSFC)

- Trent L. Schindler (USRA)
-
Greg Shirah
(NASA/GSFC)
-
Scientist
- William Putman (NASA/GSFC)
-
Project support
- Laurence Schuler (ADNET Systems, Inc.)
- Ian Jones (ADNET Systems, Inc.)
Series
This page can be found in the following series:Datasets used
-
GEOS-5 Cubed-Sphere (GEOS-5 Atmospheric Model on the Cubed-Sphere)
ID: 663The model is the GEOS-5 atmospheric model on the cubed-sphere, run at 14-km global resolution for 30-days. GEOS-5 is described here http://gmao.gsfc.nasa.gov/systems/geos5/ and the cubed-sphere work is described here http://sivo.gsfc.nasa.gov/cubedsphere_overview.html.
See all pages that use this dataset
Note: While we identify the data sets used on this page, we do not store any further details, nor the data sets themselves on our site.
Related
- ID: 11637
- ID: 11632
 Produced Video
Release date
This page was originally published on Sunday, August 10, 2014.
This page was last updated on Wednesday, May 3, 2023 at 1:50 PM EDT.