Reconnection Fronts - What the Models Say...
Mathematical models of Earth's magnetosphere have become increasingly more complex and accurate. They have sufficient detail to illustrate many small-scale phenomena.
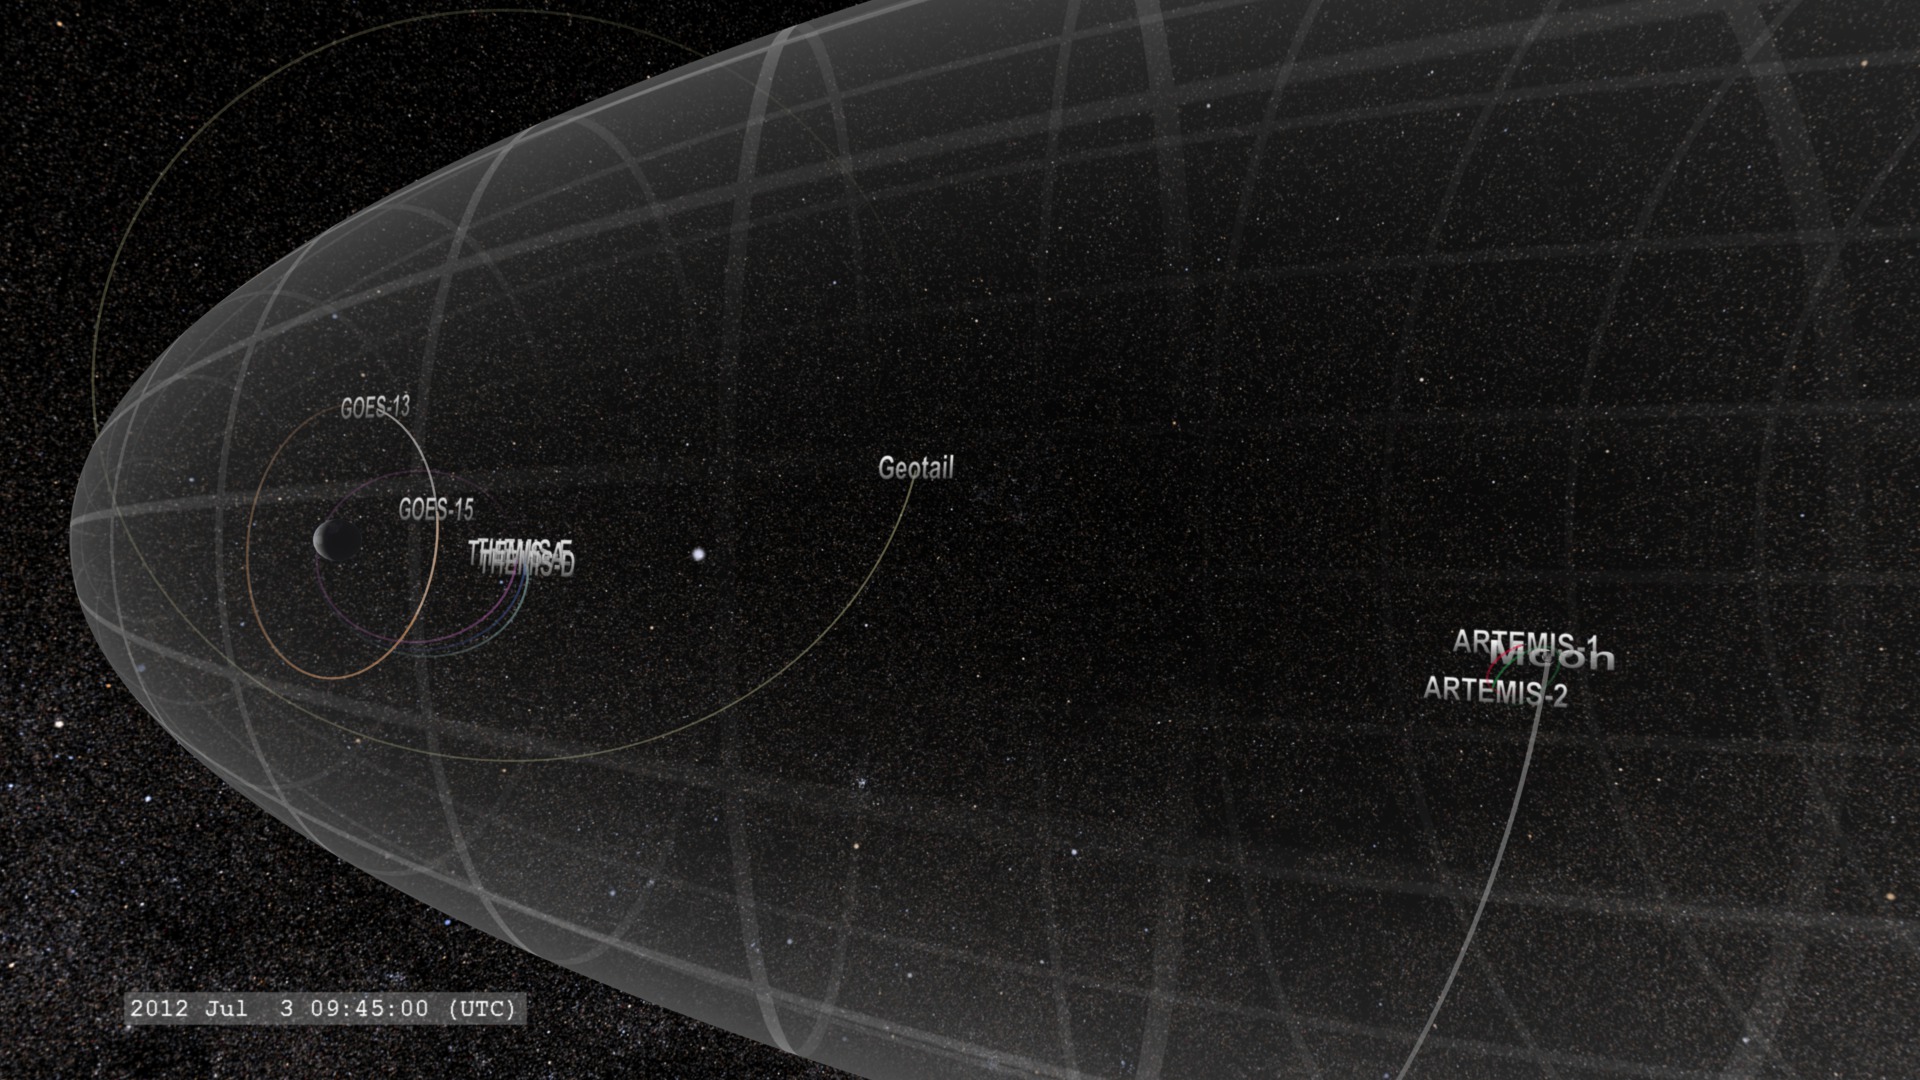
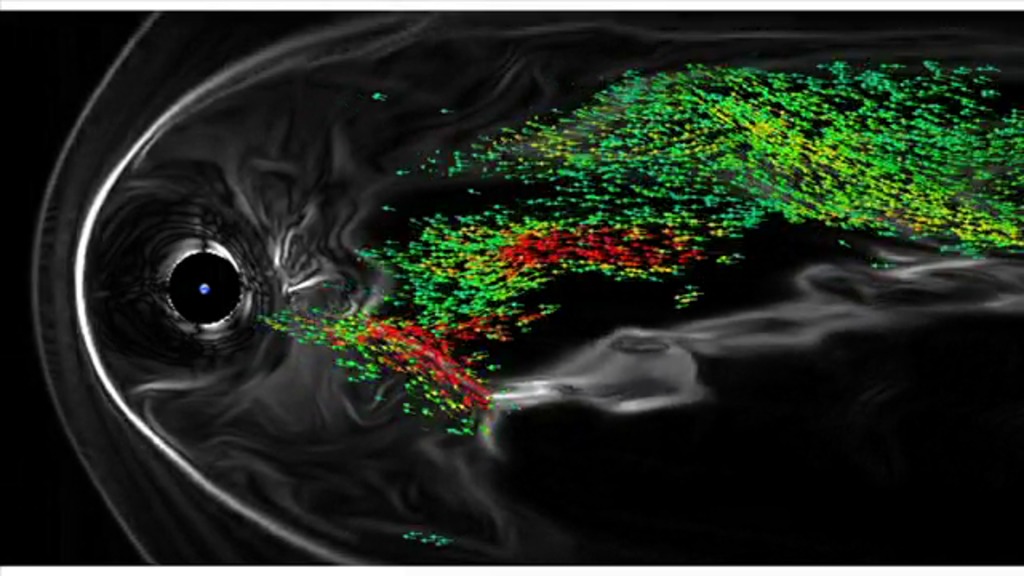
In this simulation run of the Geospace General Circulation Model (GGCM) we see new details that have been observed by in situ satellites. As the solar wind is deflected around Earth's magnetosphere (the 'bubble' of plasma surrounding Earth held by Earth's magnetic field), plasma flows within the bubble can change. In the graphics below, physical variables such as magnetic field and electric currents are plotted. With these variables, we overlay the net flow of the plasma (arrows), subjected to selection criteria to separate flows of plasma away from Earth and towards Earth. Green arrows are low-speed flows (below about 150 kilometers/second), while red arrows correspond to high-speed plasmal flows (about 300 kilometers/second and higher).
Magnetic field in x-y plane (approximately Earth equatorial plane) but pointed in the z-direction. Purple has the field pointed towards the camera, orange has the field pointed away from the camera. The solar wind approaches Earth (blue dot) from the left. The magnetotail extends to the right.
Magnetic field in x-y plane (approximately Earth equatorial plane) but pointed in the z-direction with plasma flows directed TOWARDS Earth. Purple has the field pointed towards the camera, orange has the field pointed away from the camera. The solar wind approaches Earth (blue dot) from the left. The magnetotail extends to the right.
Magnetic field in x-y plane (approximately Earth equatorial plane) but pointed in the z-direction with plasma flows directed away from Earth towards the magnetotail. Purple has the field pointed towards the camera, orange has the field pointed away from the camera. The solar wind approaches Earth (blue dot) from the left. The magnetotail extends to the right.
Electric current in the x-y plane (approximately Earth equatorial plane). White corresponds to regions of high current density, black to low current density. The solar wind approaches Earth (blue dot) from the left. The magnetotail extends to the right.
Electric current in the x-y plane (approximately Earth equatorial plane) with plasma flows directed TOWARDS Earth. White corresponds to regions of high current density, black to low current density. The solar wind approaches Earth (blue dot) from the left. The magnetotail extends to the right.
Electric current in the x-y plane (approximately Earth equatorial plane) with plasma flows directed away from Earth towards the magnetotail. White corresponds to regions of high current density, black to low current density. The solar wind approaches Earth (blue dot) from the left. The magnetotail extends to the right.
For More Information
Credits
Please give credit for this item to:
NASA's Goddard Space Flight Center Scientific Visualization Studio
-
Animator
- Tom Bridgman (Global Science and Technology, Inc.)
-
Video editor
- Genna Duberstein (USRA)
-
Scientists
- Vassilis Angelopoulos (University of California at Berkeley)
- Joachim Raeder (University of New Hampshire)
-
Writer
- Karen Fox (ADNET Systems, Inc.)
Missions
This page is related to the following missions:Datasets used
-
GGCM [Geospace General Circulation Model (GGCM)]
ID: 582MHD Magnetospheric simulation
This dataset can be found at: http://openggcm.sr.unh.edu/wiki/index.php/Main_Page
See all pages that use this dataset
Note: While we identify the data sets used on this page, we do not store any further details, nor the data sets themselves on our site.
Related
- ID: 4080
 Visualization
 - ID: 11309
 Produced Video
Release date
This page was originally published on Thursday, September 26, 2013.
This page was last updated on Wednesday, May 3, 2023 at 1:51 PM EDT.