Moon Phase and Libration, 2013 South Up

Enter a time to see what the moon looked like (or will look like) at that time.
| Time (UTC) | 2023-01-01T00:00 |
|---|---|
| Phase | 00.0% (0d 0h 0m) |
| Diameter | 0000.0 arcseconds |
| Distance | 00.0 km (0.00 Earth diameters) |
| J2000 Right Ascension, Declination | 0h 0m 0s, 0° 0' 0" |
| Sub-Solar Longitude, Latitude | 0.000°, 0.000° |
| Sub-Earth Longitude, Latitude | 0.000°, 0.000° |
| Position Angle | 0.000° |
The data in the table for the entire year can be downloaded as a JSON file or as a text file.
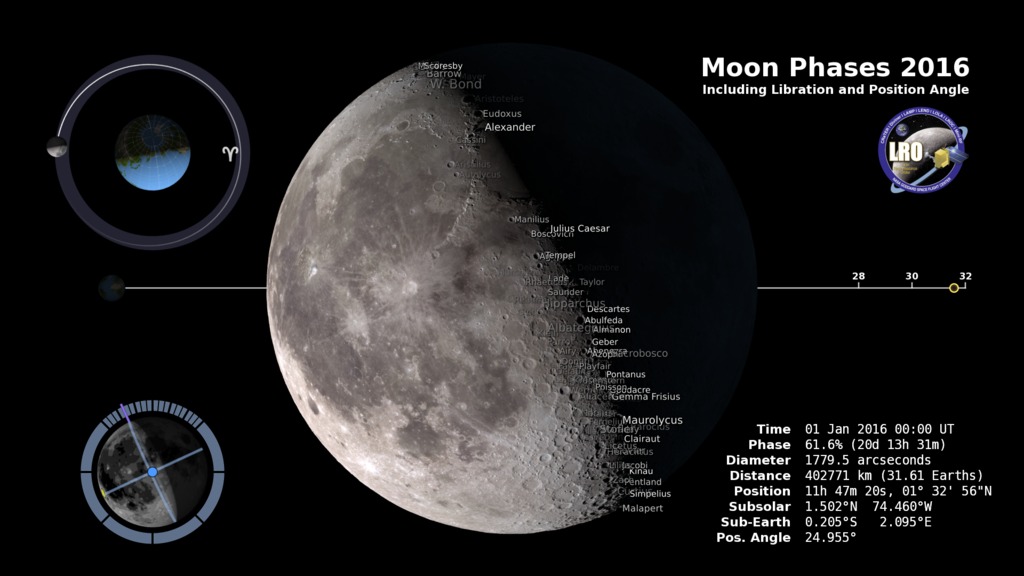
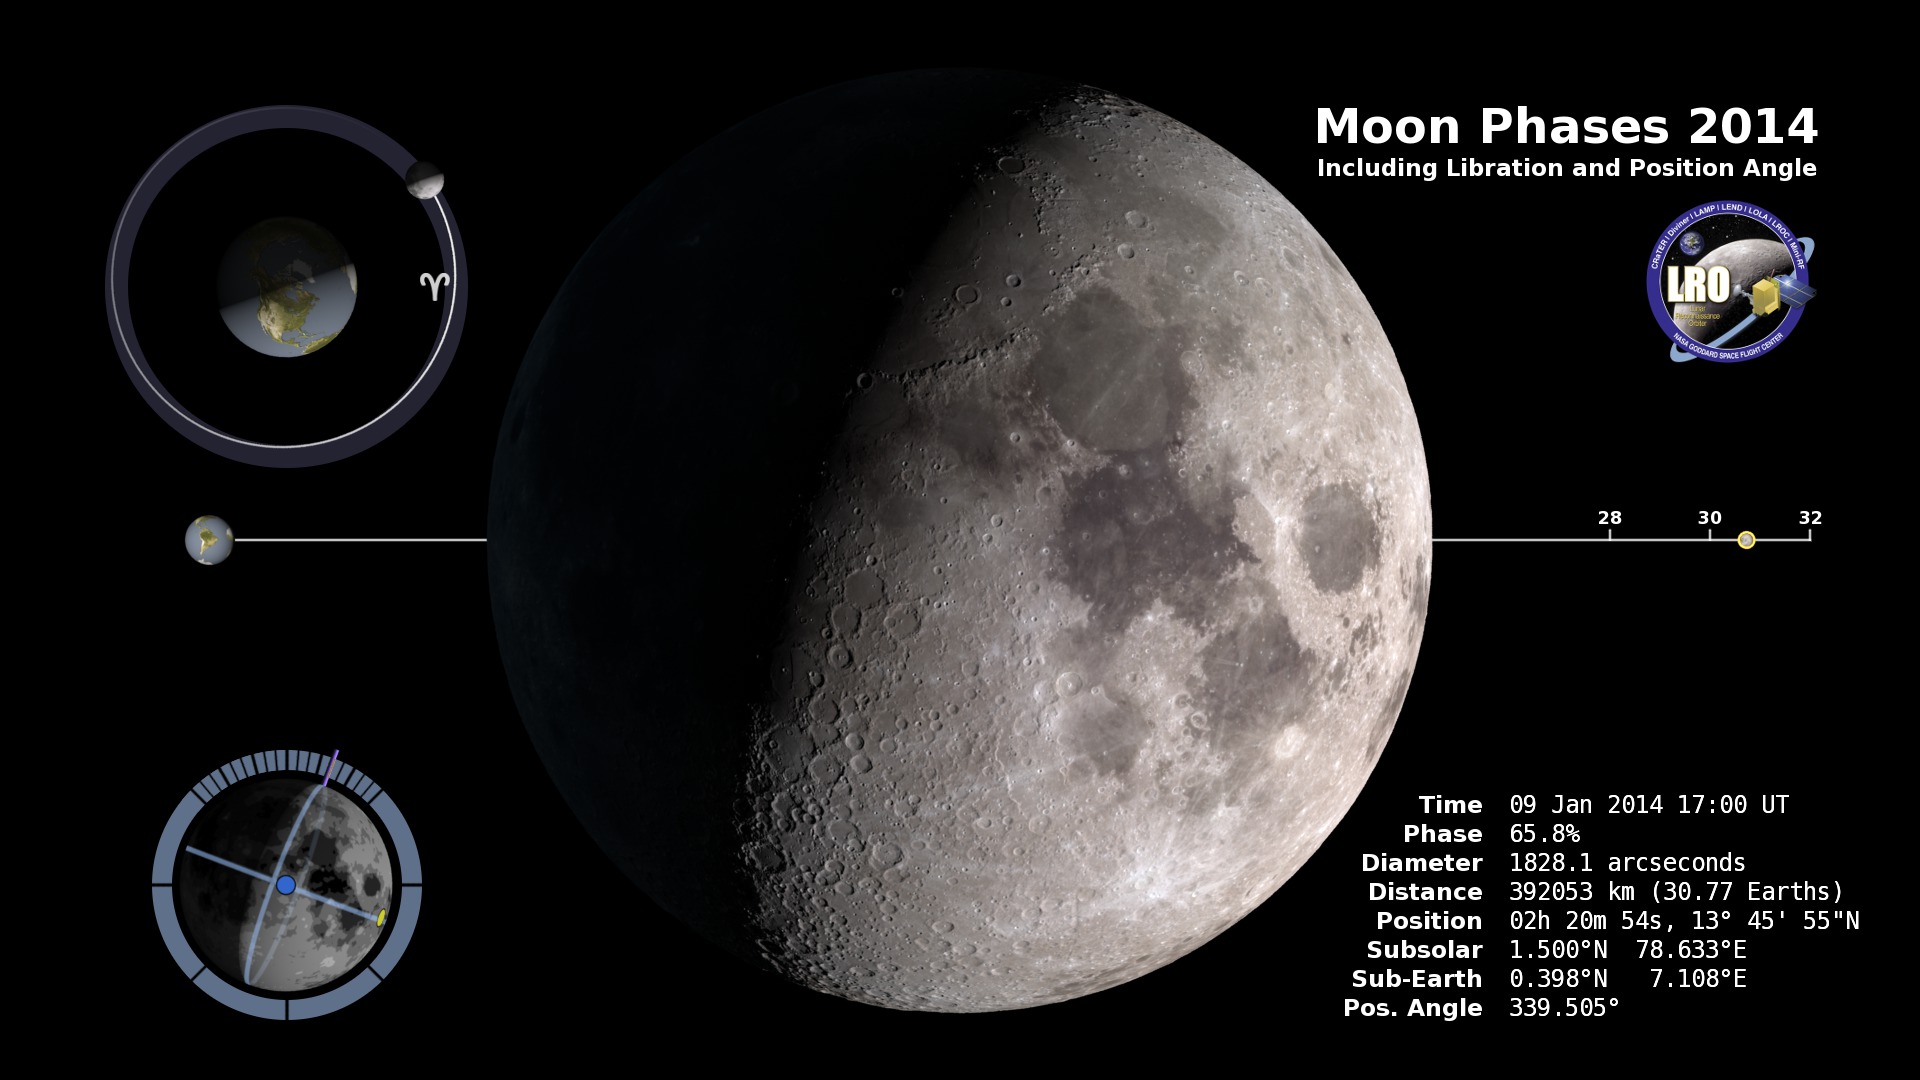
The animation archived on this page shows the geocentric phase, libration, position angle of the axis, and apparent diameter of the Moon throughout the year 2013, at hourly intervals. Until the end of 2013, the initial Dial-A-Moon image will be the frame from this animation for the current hour.
More in this series:
Moon Phase and Libration Gallery
The jagged, cratered, airless lunar terrain casts sharp shadows that clearly outline the Moon's surface features for observers on Earth. This is especially true near the terminator, the line between day and night, where surface features appear in high relief. Elevation measurements by the Lunar Orbiter Laser Altimeter (LOLA) aboard the Lunar Reconnaissance Orbiter (LRO) make it possible to simulate shadows on the Moon's surface with unprecedented accuracy and detail.
The Moon always keeps the same face to us, but not exactly the same face. Because of the tilt and shape of its orbit, we see the Moon from slightly different angles over the course of a month. When a month is compressed into 24 seconds, as it is in this animation, our changing view of the Moon makes it look like it's wobbling. This wobble is called libration.
The word comes from the Latin for "balance scale" (as does the name of the zodiac constellation Libra) and refers to the way such a scale tips up and down on alternating sides. The sub-Earth point gives the amount of libration in longitude and latitude. The sub-Earth point is also the apparent center of the Moon's disk and the location on the Moon where the Earth is directly overhead.
The Moon is subject to other motions as well. It appears to roll back and forth around the sub-Earth point. The roll angle is given by the position angle of the axis, which is the angle of the Moon's north pole relative to celestial north. The Moon also approaches and recedes from us, appearing to grow and shrink. The two extremes, called perigee (near) and apogee (far), differ by more than 10%.
The most noticed monthly variation in the Moon's appearance is the cycle of phases, caused by the changing angle of the Sun as the Moon orbits the Earth. The cycle begins with the waxing (growing) crescent Moon visible in the west just after sunset. By first quarter, the Moon is high in the sky at sunset and sets around midnight. The full Moon rises at sunset and is high in the sky at midnight. The third quarter Moon is often surprisingly conspicuous in the daylit western sky long after sunrise.
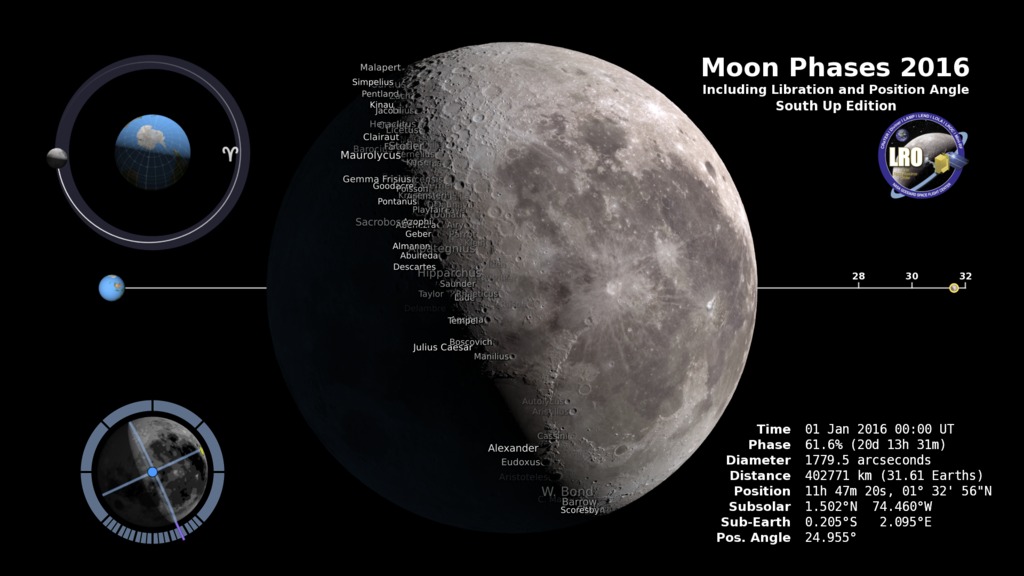
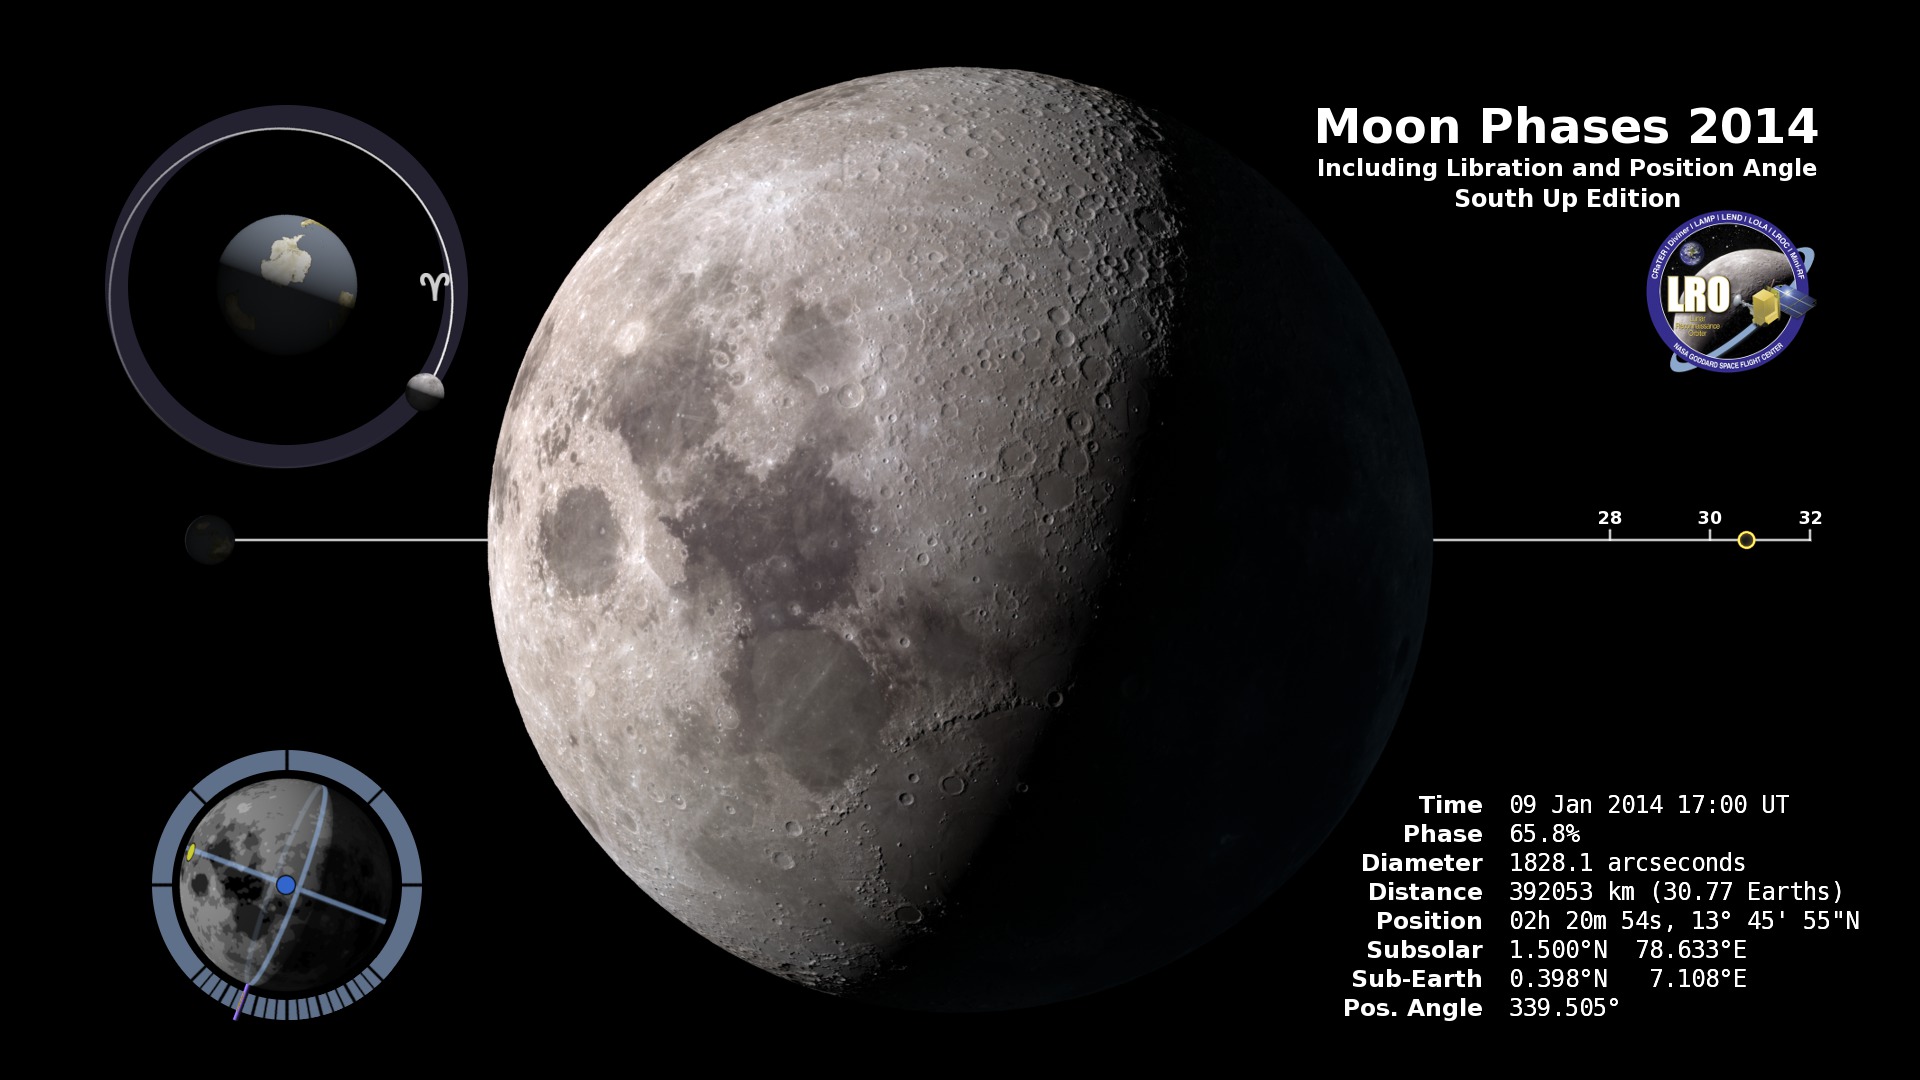
Celestial south is up in these images, corresponding to the view from the southern hemisphere. The descriptions of the print resolution stills also assume a southern hemisphere orientation. (There is also a north-up version of this page.)
The phase and libration of the Moon for 2013, at hourly intervals. Includes supplemental graphics that display the Moon's orbit, subsolar and sub-Earth points, and the Moon's distance from Earth at true scale.
The phase and libration of the Moon for 2013, at hourly intervals. Includes supplemental graphics that display the Moon's orbit, subsolar and sub-Earth points, and the Moon's distance from Earth at true scale. This version also features Brazilian Samba music and credit slates.
The phase and libration of the Moon for 2013, at hourly intervals. The full-resolution frames include an alpha channel.
The phase and libration of the Moon for 2013, at hourly intervals. This version also features Brazilian Samba music and credit slates.
The orbit of the Moon in 2013, viewed from the south pole of the ecliptic, with the vernal equinox to the right. The sizes of the Earth and Moon are exaggerated by a factor of 25. The frames include an alpha channel.
From this birdseye view, it's somewhat easier to see that the phases of the Moon are an effect of the changing angles of the sun, Moon and Earth. The Moon is full when its orbit places it in the middle of the night side of the Earth. First and Third Quarter Moon occur when the Moon is along the day-night line on the Earth.
The First Point of Aries is at the 3 o'clock position in the image. The sun is in this direction at the spring equinox. You can check this by freezing the animation at the 1:03 mark, or by freezing the full animation with the time stamp near March 20 at 11:00 UTC. This direction serves as the zero point for both ecliptic longitude and right ascension.
The south pole of the Earth is tilted 23.5 degrees toward the 12 o'clock position at the top of the image. The tilt of the Earth is important for understanding why the north pole of the Moon seems to swing back and forth. In the full animation, watch both the orbit and the "gyroscope" Moon in the lower left. The widest swings happen when the Moon is at the 3 o'clock and 9 o'clock positions. When the Moon is at the 3 o'clock position, the ground we're standing on is tilted to the left when we look at the Moon. At the 9 o'clock position, it's tilted to the right. The tilt itself doesn't change. We're just turned around, looking in the opposite direction.
An animated diagram of the subsolar and sub-Earth points for 2013. The Moon's north pole, equator, and meridian are indicated. The frames include an alpha channel.
The subsolar and sub-Earth points are the locations on the Moon's surface where the sun or the Earth are directly overhead, at the zenith. A line pointing straight up at one of these points will be pointing toward the sun or the Earth. The sub-Earth point is also the apparent center of the Moon's disk as observed from the Earth.
In the animation, the blue dot is the sub-Earth point, and the yellow dot is the subsolar point. The lunar latitude and longitude of the sub-Earth point is a measure of the Moon's libration. For example, when the blue dot moves to the left of the meridian (the line at 0 degrees longitude), an extra bit of the Moon's eastern limb is rotating into view, and when it moves above the equator, a bit of the far side beyond the south pole becomes visible.
At any given time, half of the Moon is in sunlight, and the subsolar point is in the center of the lit half. Full Moon occurs when the subsolar point is near the center of the Moon's disk. When the subsolar point is somewhere on the far side of the Moon, observers on Earth see a crescent phase.
An animated diagram of the Moon's distance from the Earth for 2013. The sizes and distances are true to scale, and the lighting and Earth-tilt are correct. The frames include an alpha channel.
The Moon's orbit around the Earth isn't a perfect circle. The orbit is slightly elliptical, and because of that, the Moon's distance from the Earth varies between 28 and 32 Earth diameters, or about 356,400 and 406,700 kilometers. In each orbit, the smallest distance is called perigee, from Greek words meaning "near earth," while the greatest distance is called apogee. The Moon looks largest at perigee because that's when it's closest to us.
The animation follows the imaginary line connecting the Earth and the Moon as it sweeps around the Moon's orbit. From this vantage point, it's easy to see the variation in the Moon's distance. Both the distance and the sizes of the Earth and Moon are to scale in this view. In the full-resolution frames, the Earth is 50 pixels wide, the Moon is 14 pixels wide, and the distance between them is about 1500 pixels, on average.
Note too that the Earth appears to go through phases just like the Moon does. For someone standing on the surface of the Moon, the sun and the stars rise and set, but the Earth doesn't move in the sky. It goes through a monthly sequence of phases as the sun angle changes. The phases are the opposite of the Moon's. During New Moon here, the Earth is full as viewed from the Moon.

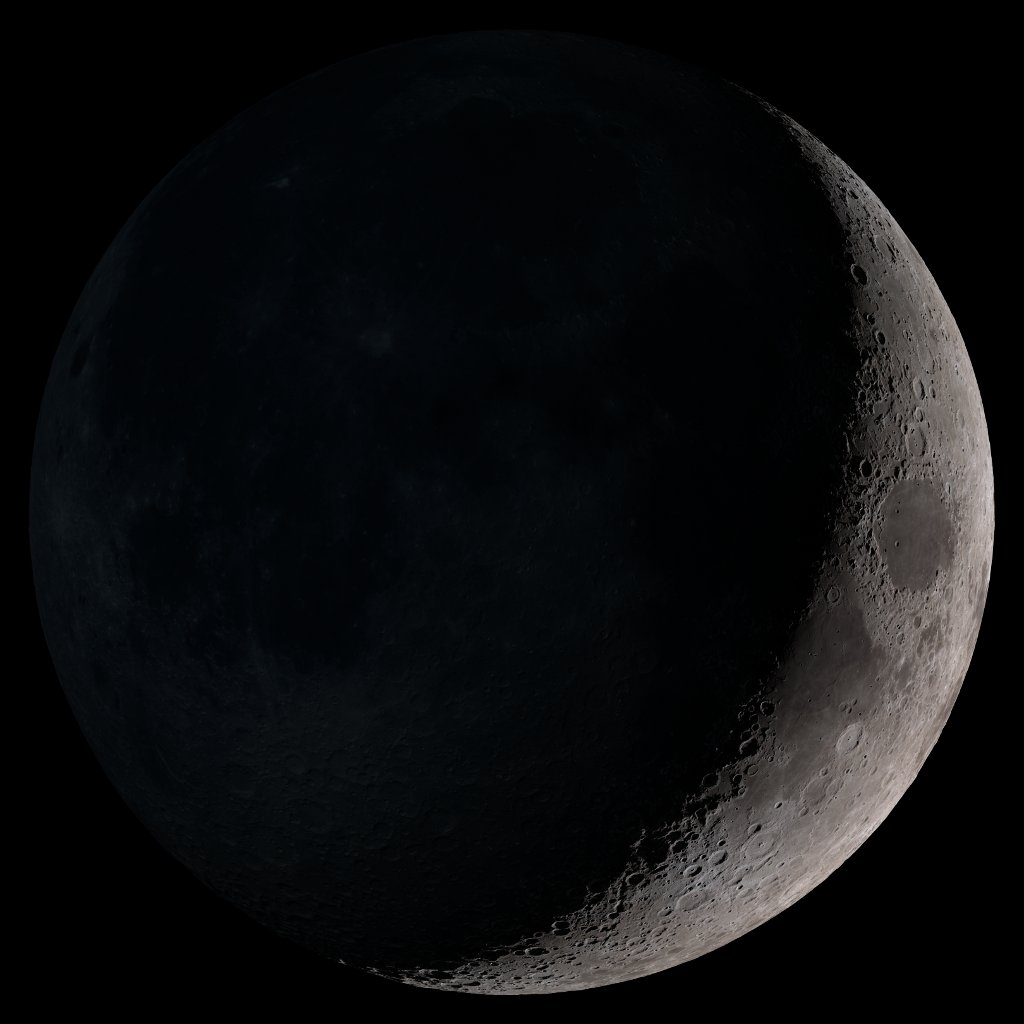
Waxing crescent. Visible toward the northwest in early evening.
First quarter. Visible high in the northern sky in early evening.
Waxing gibbous. Visible to the northeast in early evening, up for most of the night.
Full Moon. Rises at sunset, high in the sky around midnight. Visible all night.
Waning gibbous. Rises after sunset, high in the sky after midnight, visible to the northwest after sunrise.
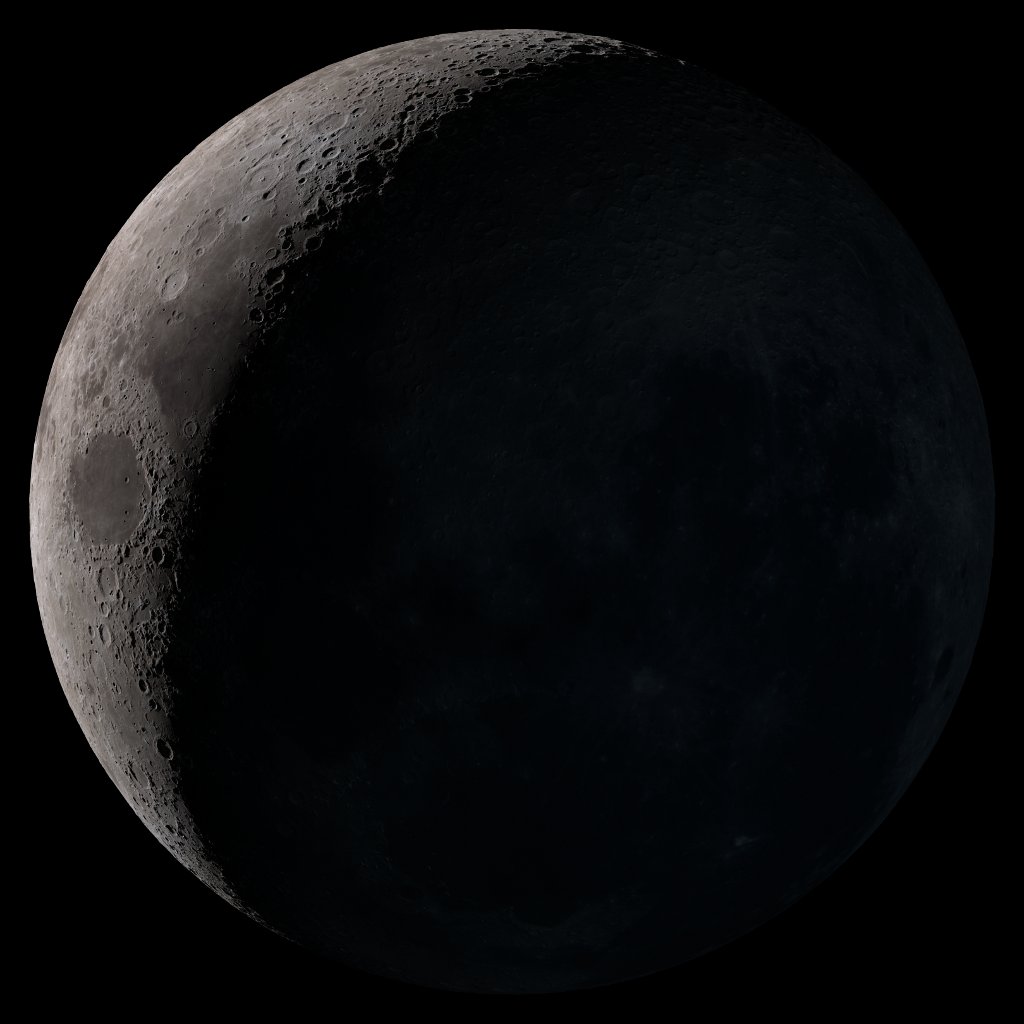
Third quarter. Rises around midnight, visible to the north after sunrise.
Waning crescent. Low to the east before sunrise.
New Moon. By the modern definition, New Moon occurs when the Moon and Sun are at the same geocentric ecliptic longitude. The part of the Moon facing us is completely in shadow then. Pictured here is the traditional New Moon, the earliest visible waxing crescent, which signals the start of a new month in many lunar and lunisolar calendars.
Credits
Please give credit for this item to:
NASA's Goddard Space Flight Center Scientific Visualization Studio
-
Animator
-
Ernie Wright
(USRA)

-
Ernie Wright
(USRA)
-
Producer
- Dan Gallagher (USRA)
-
Scientist
- John Keller (NASA/GSFC)
-
Project support
- Joycelyn Thomson Jones (NASA/GSFC)
Missions
This page is related to the following missions:Series
This page can be found in the following series:Tapes
The media on this page originally appeared on the following tapes:-
Moon Phase South Up 2013
(ID: 2013053)
Wednesday, June 5, 2013 at 4:00AM
Produced by - Dan Jacob (Global Science and Technology, Inc.)
Datasets used
-
750-nm Basemap [Clementine: UVVIS Camera]
ID: 545 -
DEM (Digital Elevation Map) [LRO: LOLA]
ID: 653 -
DE421 (JPL DE421)
ID: 752Planetary ephemerides
This dataset can be found at: http://ssd.jpl.nasa.gov/?ephemerides#planets
See all pages that use this dataset
Note: While we identify the data sets used on this page, we do not store any further details, nor the data sets themselves on our site.
Related
- ID: 4404
 Visualization
 - ID: 4405
 Visualization
 - ID: 4236
 Visualization
 - ID: 4237
 Visualization
 - ID: 4118
 Visualization
 - ID: 4119
 Visualization
 - ID: 4000
 Visualization
 - ID: 3894
 Visualization
 - ID: 3810
 Visualization
Release date
This page was originally published on Wednesday, June 5, 2013.
This page was last updated on Monday, November 13, 2023 at 1:43 PM EST.