Sunspot Growth in June 2012
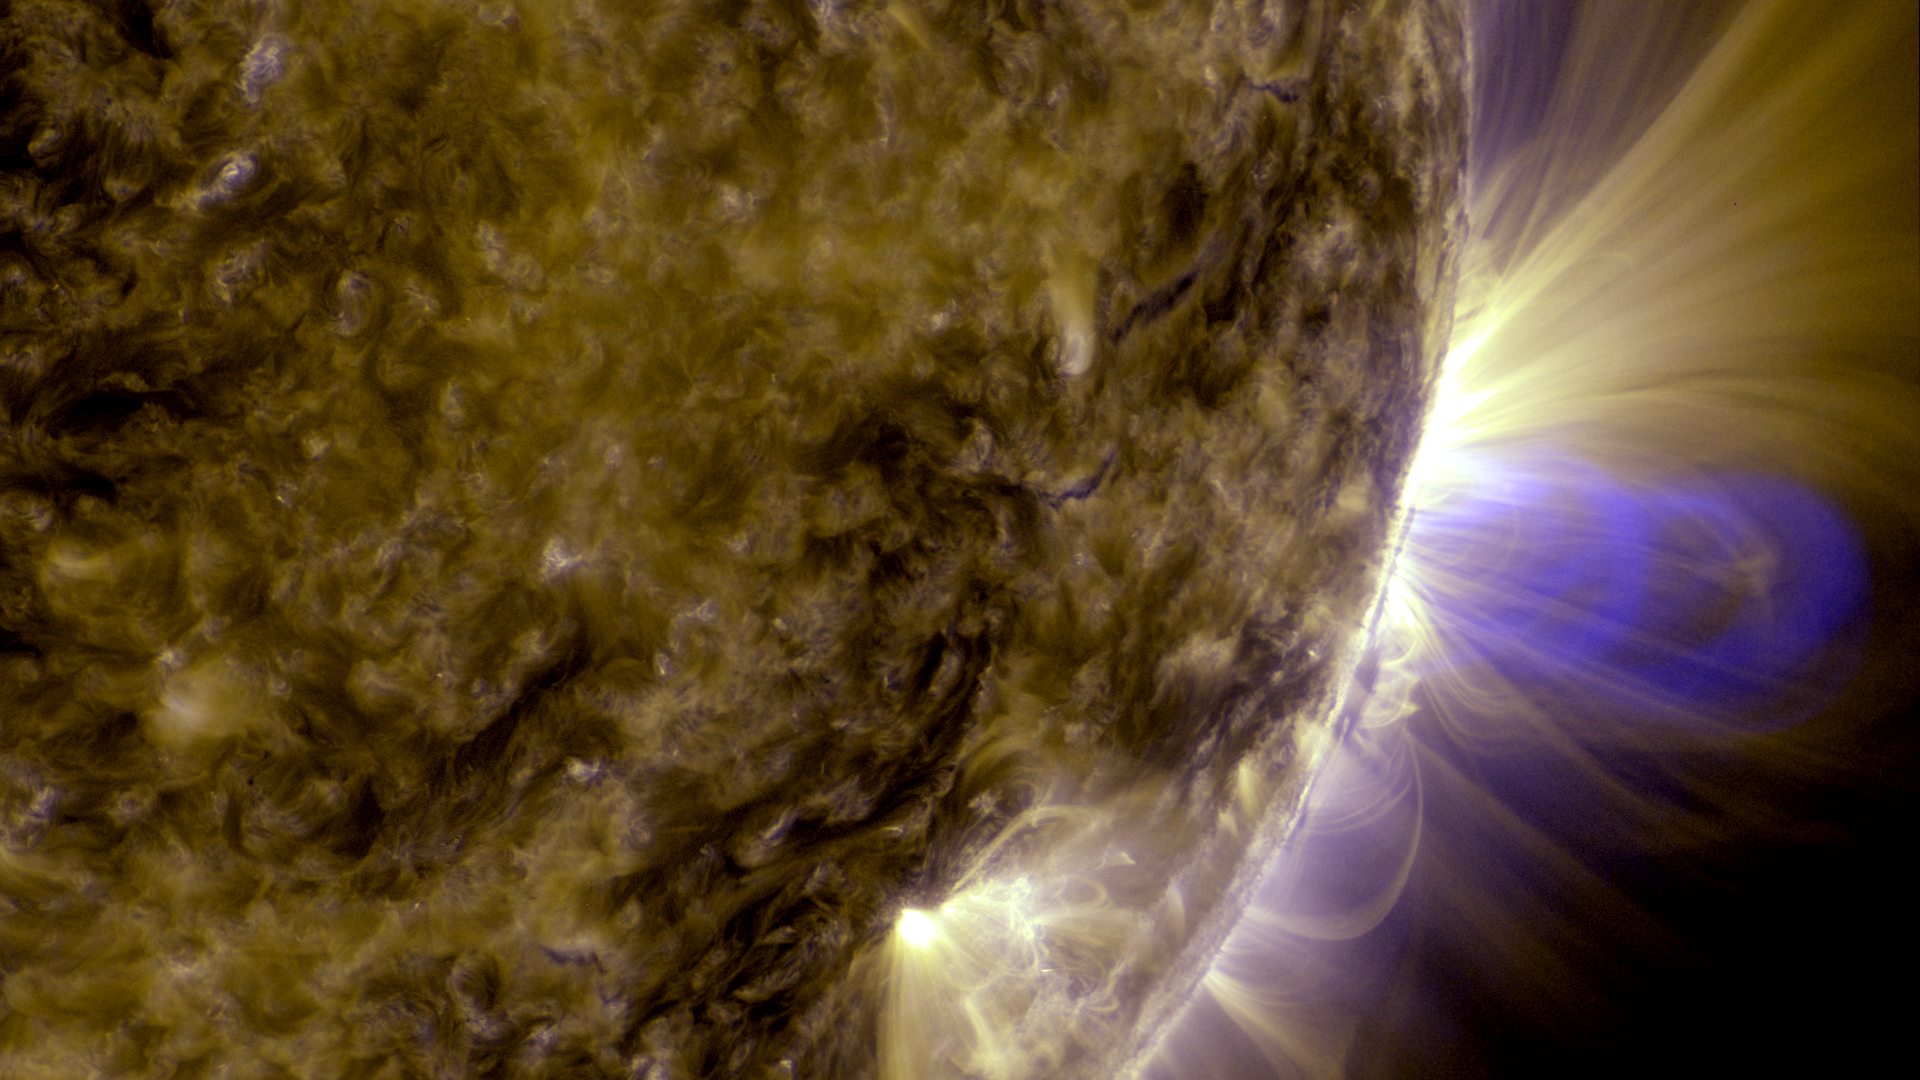
Groups of sunspots grow and die over a matter of days. This is a movie built from images taken by the SDO/HMI instrument over the course of 13 days during the rise of solar cycle 24.
An HD movie of the sunspot evolution.
Full resolution, colorized 4Kx4K frames of the sunspot evolution.
Credits
Please give credit for this item to:
NASA's Goddard Space Flight Center Scientific Visualization Studio, the SDO Science Team, and the Virtual Solar Observatory.
-
Animator
- Tom Bridgman (Global Science and Technology, Inc.)
-
Producer
- Scott Wiessinger (USRA)
-
Writer
- Karen Fox (ADNET Systems, Inc.)
Missions
This page is related to the following missions:Series
This page can be found in the following series:Datasets used
-
SDO Continuum (Continuum) [SDO: HMI]
ID: 674
Note: While we identify the data sets used on this page, we do not store any further details, nor the data sets themselves on our site.
Related
- ID: 11203
 Produced Video
Release date
This page was originally published on Monday, February 11, 2013.
This page was last updated on Sunday, February 2, 2025 at 10:10 PM EST.