Seasonal Antarctic Sea Ice
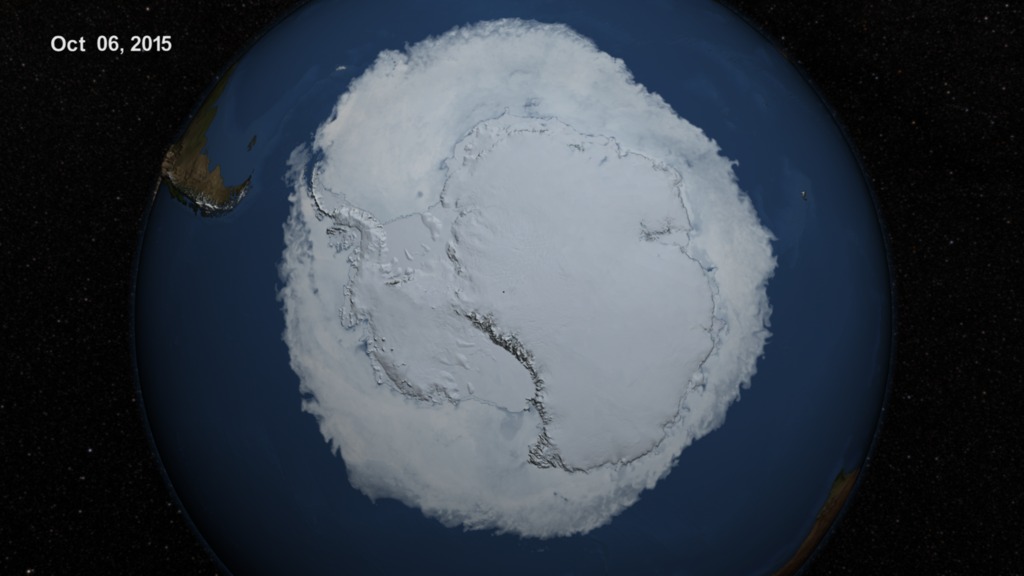
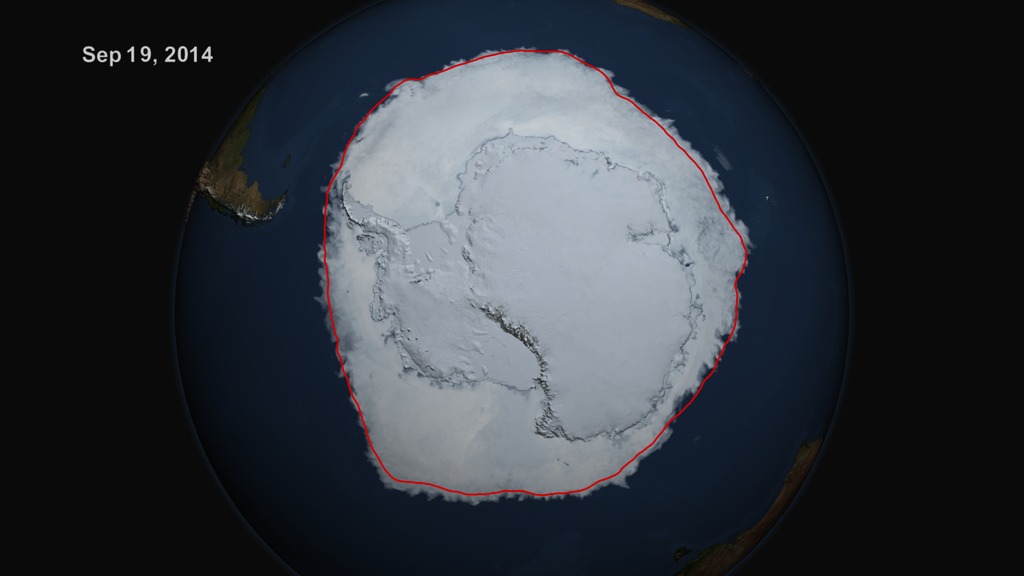
Antarctica is a land mass surrounded by an ocean which allows the sea ice here to move more freely than it does in the Northern Hemisphere. Because there are no surrounding continents to limit its movement, the sea ice is free to float northward into warmer waters where it eventually melts. As a result, almost all of the sea ice that forms during the Antarctic winter melts during the summer. During the winter, up to 18 million square kilometers (6.9 million square miles) of ocean is covered by sea ice, but by the end of summer, only about 3 million square kilometers (1.1 million square miles) of sea ice remain. Antarctic sea ice extent are characterized by fairly large variations from year to year. The monthly average extent can vary by as much as 1 million square kilometers (386,102 square miles) from the year-to-year monthly average.
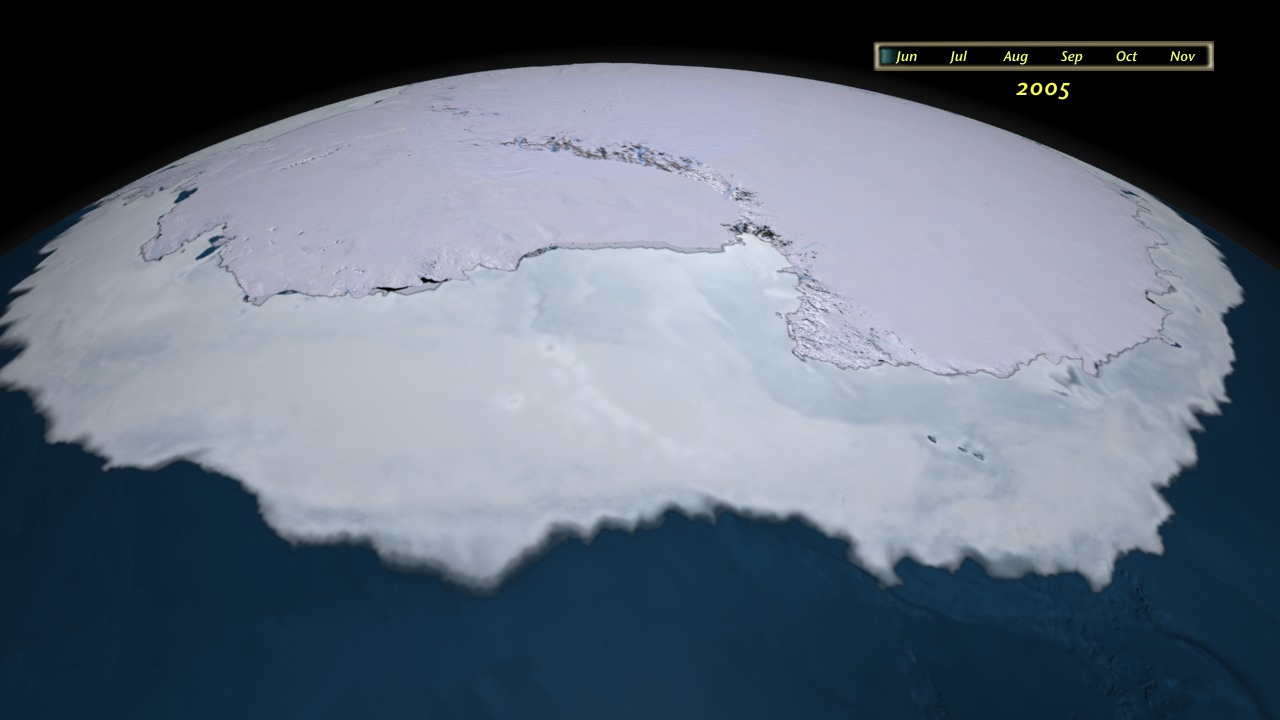
The AMSR-E instrument on the Aqua satellite acquires high resolution measurements of the 89 GHz brightness temperature near the poles. Because this is a passive microwave sensor which is not so sensitive to atmospheric effects, this sensor is able to observe the entire polar region every day, even through clouds and snowfall. The false color in this animation of sea ice surrounding the South Pole is derived from the daily AMSR-E 6.25 km 89 GHz brightness temperature while the sea ice extent is derived from the daily AMSR-E 12.5 km sea ice concentration. The sea ice extent shown is generated using a three day moving average where the daily sea ice concentration is at least 15%. This animation portrays the changes in the sea ice from May 26, 2009 through July 29, 2010.
This animation shows the advance and retreat of the Antarctic sea ice with a star background and a date overlay.
This animation shows the advance and retreat of the Antarctic sea ice with transparency.

The star background.
Credits
Please give credit for this item to:
NASA/Goddard Space Flight Center Scientific Visualization Studio
-
Visualizer
-
Cindy Starr
(Global Science and Technology, Inc.)

-
Cindy Starr
(Global Science and Technology, Inc.)
-
Animator
- Lori Perkins (NASA/GSFC)
-
Producer
- Kayvon Sharghi (USRA)
-
Scientist
- Sinead Farrell (University of Maryland)
Missions
This page is related to the following missions:Datasets used
-
Daily L3 6.25 km 89 GHz Brightness Temperature (Tb) [Aqua: AMSR-E]
ID: 236 -
Sea Ice Concentration (Daily L3 12.5km Tb, Sea Ice Concentration, and Snow Depth) [Aqua: AMSR-E]
ID: 237 -
LIMA (Landsat Image Mosaic of Antarctica) [Landsat-7: ETM+]
ID: 599Mosaicing to avoid clouds produced a high quality, nearly cloud-free benchmark data set of Antarctica for the International Polar Year from images collected primarily during 1999-2003.
This dataset can be found at: http://lima.nasa.gov/
See all pages that use this dataset
Note: While we identify the data sets used on this page, we do not store any further details, nor the data sets themselves on our site.
Related
- ID: 4368
 Visualization
 - ID: 4219
 Visualization
 - ID: 3854
 Visualization
 - ID: 10826
 Produced Video
 - ID: 3497
 Visualization
Release date
This page was originally published on Thursday, September 29, 2011.
This page was last updated on Sunday, January 5, 2025 at 10:04 PM EST.