Ship Tracks Reveal Pollution's Effects on Clouds
NASA's MODIS satellite instrument is revealing that humans may be changing our planet's brightness. Pollution in the atmosphere creates smaller, brighter cloud droplets that reflect more sunlight back to space and may have a slight impact on global warming.
This narrated visualization illustrates how we can study the effect against a clean backdrop by looking for zones of pollution in otherwise pristine air - in this case the North Pacific Ocean near the Aleutian islands. On an overcast day, the clouds look uniform. However, MODIS' sesor reveals a different picture - long skinny trails of brighter clouds hidden within. As ships travel across the ocean, pollution in the ships' exhaust create more cloud drops that are smaller in size, resulting in even brighter clouds. On clear days, ships can actually create new clouds. Water vapor condenses around the particles of pollution, forming streamers of clouds as the ships travel on. The ship tracks themselves are too small to impact global temperatures, but they help us understand how larger pollution sources such as industrial sites or agricultural burning might be changing clouds on a larger scale.
This set provides content of the narrated scientific visualization: movies, frames, audio and transcript.
For complete transcript, click here.
This video is also available on our YouTube channel.

Earth, Sun and starfield, as seen from space on September 28, 2009.
Earth from space on September 28, 2009, as seen from MODIS.
Earth from space on September 28, 2009, as seen from MODIS.
Approaching the region of Aleutian Islands in the North Pacific.
Invisible ship tracks in infrared mode.
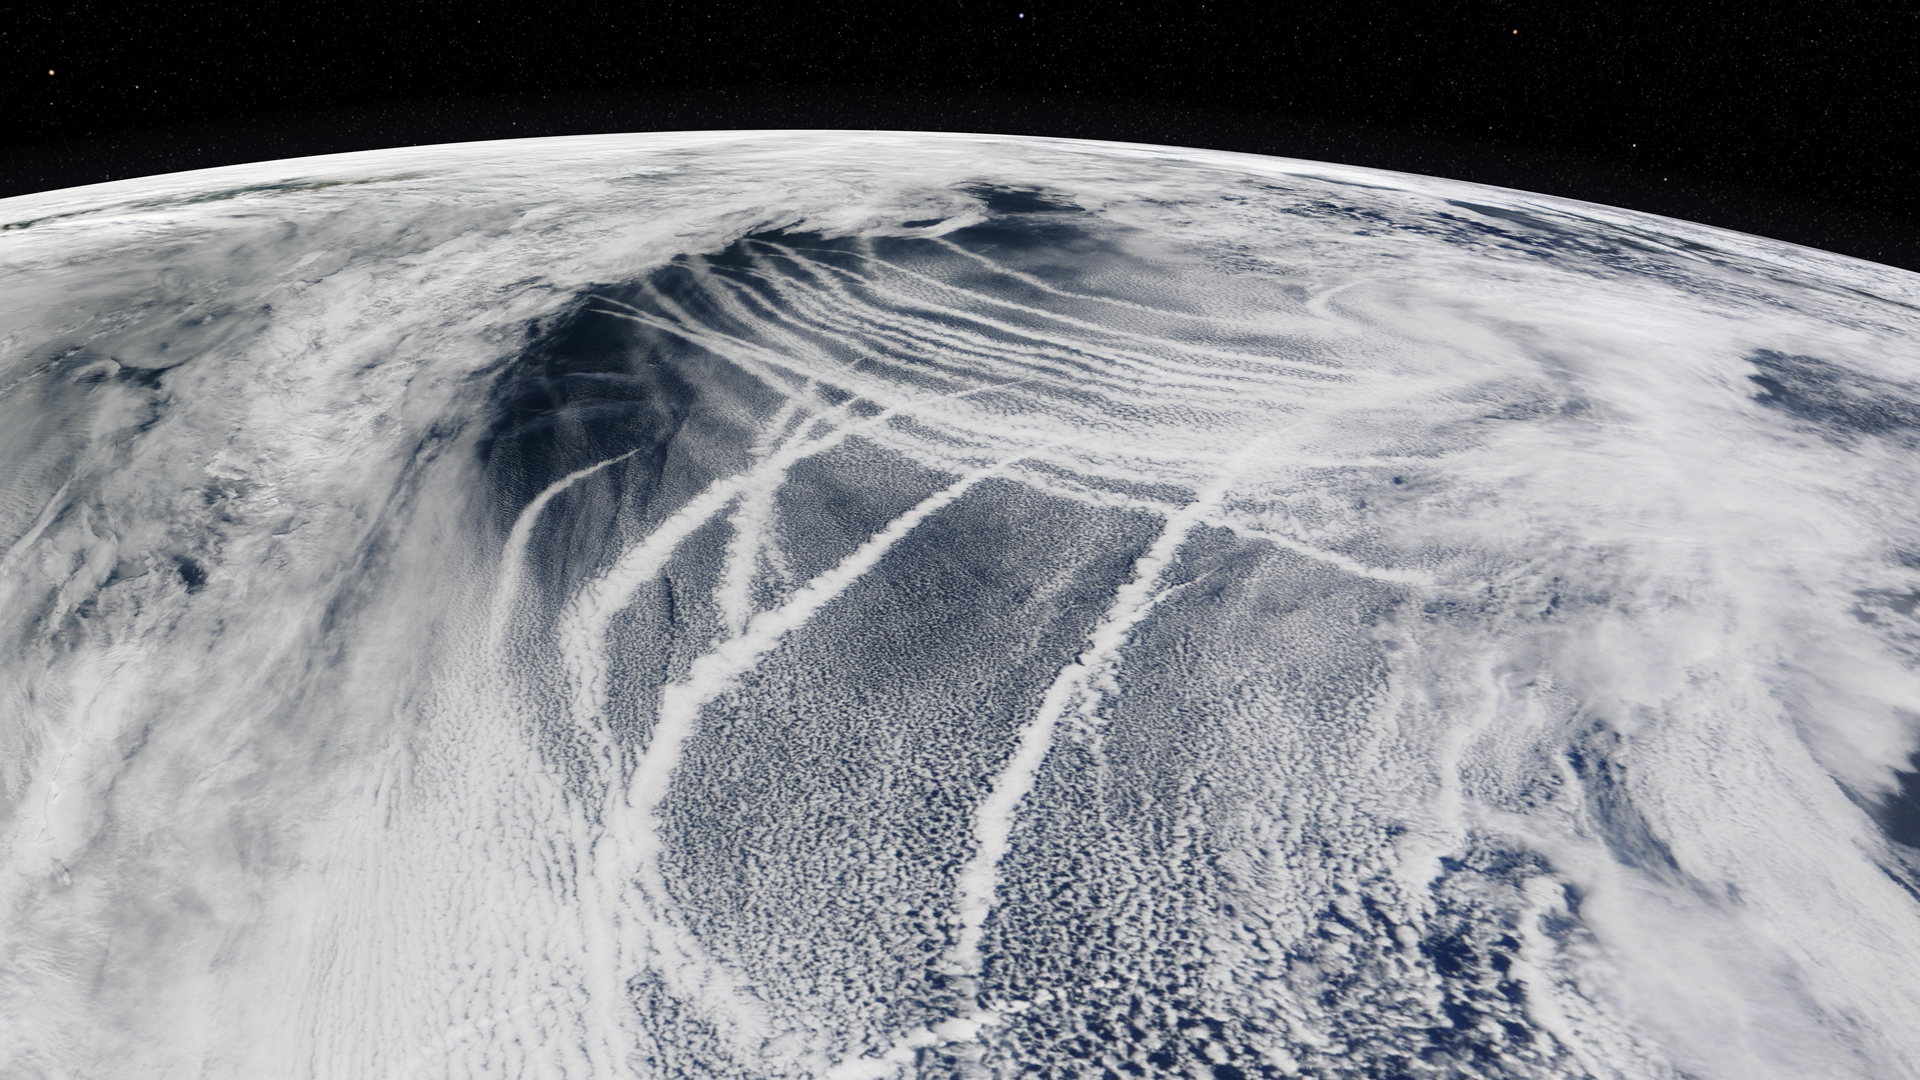
Visible ship tracks in the Nothern Pacific, on March 4th 2009
Visible ship tracks on Northern Pacific on March 4th, 2009.
Overlooking the Northern Pacific region on March 4th, 2009.
This set provides frames and movies only of the core visualization.
This set provides the first part of the visualization, without the infrared data inset of Ship Tracks in slow movement and in reverse order.
Credits
Please give credit for this item to:
NASA/Goddard Space Flight Center Scientific Visualization Studio
-
Animators
- Helen-Nicole Kostis (UMBC)
- Horace Mitchell (NASA/GSFC)
-
Greg Shirah
(NASA/GSFC)

- Ernie Wright (UMBC)
-
Narrator
- Jefferson Beck (UMBC)
-
Producer
- Jennifer A. Shoemaker (UMBC)
-
Scientists
- Michael King (NASA/GSFC)
- Galina Wind (SSAI)
Missions
This page is related to the following missions:Series
This page can be found in the following series:Datasets used
-
True Color (Band Combination 1, 4, 3) [Terra and Aqua: MODIS]
ID: 649
Note: While we identify the data sets used on this page, we do not store any further details, nor the data sets themselves on our site.
Related
- ID: 10839
 Produced Video
Release date
This page was originally published on Thursday, June 3, 2010.
This page was last updated on Wednesday, May 3, 2023 at 1:54 PM EDT.