GEOS-5 Modeled Clouds at 3.5-km Global Resolution
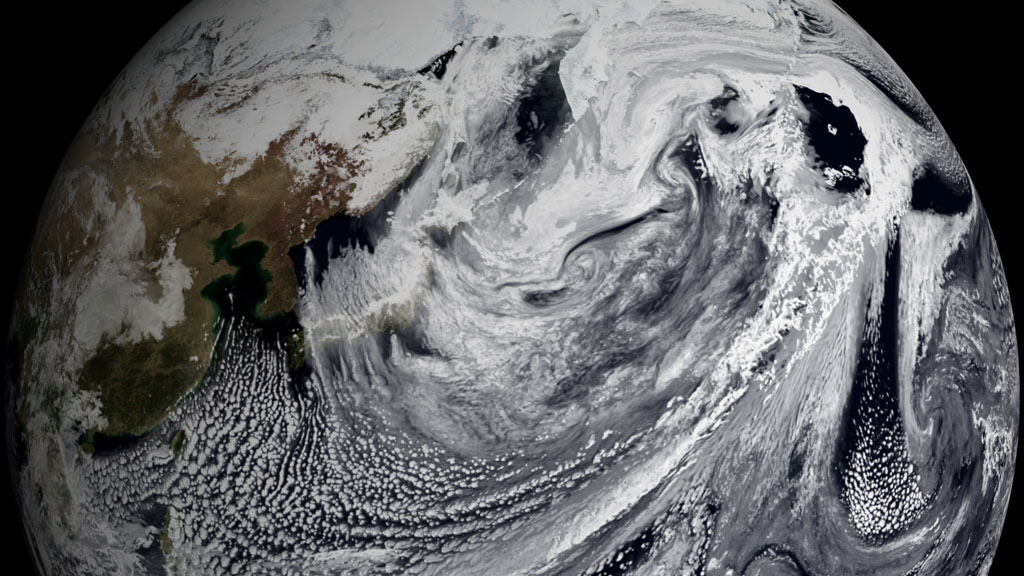
This visualization shows clouds from a simulation using the Goddard Earth Observing System Model, Verison 5 (GEOS-5). The global atmospheric simulation ran at 3.5 km per grid cell and covered a single day: January 2, 2009. The model output the results at 10 minute intervals. Since there is only one day of simulation data, the sequence of clouds repeats several times. The white flash indicates the sequence is about to repeat.
GEOS-5 Cloud Simulation at 3.5km resolution every 10 minutes

Full globe still image
Still centered over western Pacific
Still centered over middle Pacific
Still centered over eastern Pacific
Still centered over Alaska
Still centered over central Canada
Still centered over eastern Canada
Still centered over the Atlantic
Credits
Please give credit for this item to:
NASA/Goddard Space Flight Center Scientific Visualization Studio
The Blue Marble Next Generation data is courtesy of Reto Stockli (NASA/GSFC) and NASA's Earth Observatory.
-
Animator
-
Greg Shirah
(NASA/GSFC)

-
Greg Shirah
(NASA/GSFC)
-
Scientist
- William Putman (NASA/GSFC)
Missions
This page is related to the following missions:Datasets used
-
BMNG (Blue Marble: Next Generation) [Terra and Aqua: MODIS]
ID: 508Credit: The Blue Marble data is courtesy of Reto Stockli (NASA/GSFC).
This dataset can be found at: http://earthobservatory.nasa.gov/Newsroom/BlueMarble/
See all pages that use this dataset -
GEOS-5 Cubed-Sphere (GEOS-5 Atmospheric Model on the Cubed-Sphere)
ID: 663The model is the GEOS-5 atmospheric model on the cubed-sphere, run at 14-km global resolution for 30-days. GEOS-5 is described here http://gmao.gsfc.nasa.gov/systems/geos5/ and the cubed-sphere work is described here http://sivo.gsfc.nasa.gov/cubedsphere_overview.html.
See all pages that use this dataset
Note: While we identify the data sets used on this page, we do not store any further details, nor the data sets themselves on our site.
Related
- ID: 3793
 Visualization
Release date
This page was originally published on Monday, November 16, 2009.
This page was last updated on Wednesday, May 3, 2023 at 1:54 PM EDT.