Lunar Reconnaissance Orbiter (LRO) Orbit Insertion
This visualization shows an example of how the orbit insertion for the Lunar Reconnaissance Orbiter (LRO) might look. LRO launches from Cape Canaveral, then flies around the Earth and on to the moon. Time speeds up during the journey to the moon, then slows again as LRO approaches the moon. LRO begins orbiting the moon and, through a series of several "burns", moves in closer to its desired orbit. LRO's initial orbit plane around the moon is parallel to the direction of the moon's travel.
This visualization was created before launch using simulated ephemeris data. The ephemeris data driving this visualization was based on a simulated nighttime launch on 11/24/2008; but, the actual launch may happen during the daytime.
A stereoscopic version of this visualization can be found HERE. For more information on the coodinate systems in the animation see HERE.
LRO orbit insertion with elapsed time since launch
LRO orbit insertion without elapsed time since launch

LRO launches from Cape Canaveral, Florida
LRO in transit to the moon
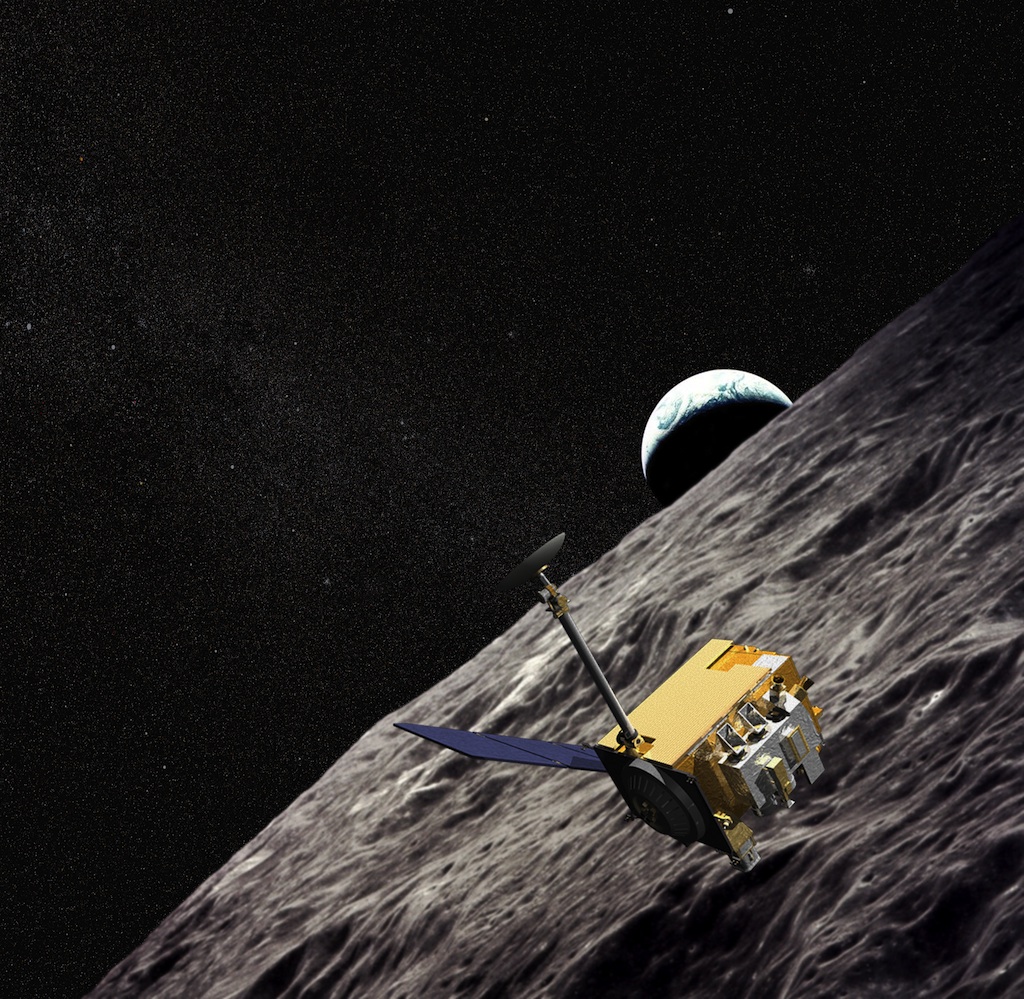
LRO approaches the moon
LRO during lunar orbit insertion
LRO in elliptical orbit around the moon
LRO's orbit gets closer to circular around the moon
LRO's orbit gets even closer to circular around the moon
LRO's orbit nearly circular around the moon
For More Information
Credits
Please give credit for this item to:
NASA/Goddard Space Flight Center Scientific Visualization Studio Simulated ephemeris data from Mark Beckman
-
Animators
-
Greg Shirah
(NASA/GSFC)

- Ernie Wright (UMBC)
-
Alex Kekesi
(Global Science and Technology, Inc.)
- Horace Mitchell (NASA/GSFC)
-
Greg Shirah
(NASA/GSFC)
-
Producer
- Andrew Freeberg (NASA/GSFC)
-
Scientist
- John Keller (NASA/GSFC)
Missions
This page is related to the following missions:Series
This page can be found in the following series:Tapes
The media on this page originally appeared on the following tapes:-
LRO Pre-Launch Resource Tape
(ID: 2009030)
Tuesday, April 7, 2009 at 4:00AM
Produced by - Andy Acuna (Hughes STX)
Datasets used
-
LRO-Simulated Ephemeris
ID: 564 -
CPC (Climate Prediction Center) Cloud Composite
ID: 600Global cloud cover from multiple satellites
See all pages that use this dataset
Note: While we identify the data sets used on this page, we do not store any further details, nor the data sets themselves on our site.
Related
- ID: 11242
 Produced Video
Release date
This page was originally published on Friday, May 8, 2009.
This page was last updated on Sunday, January 5, 2025 at 10:02 PM EST.