A newer version of this visualization is available.
Draining the Oceans
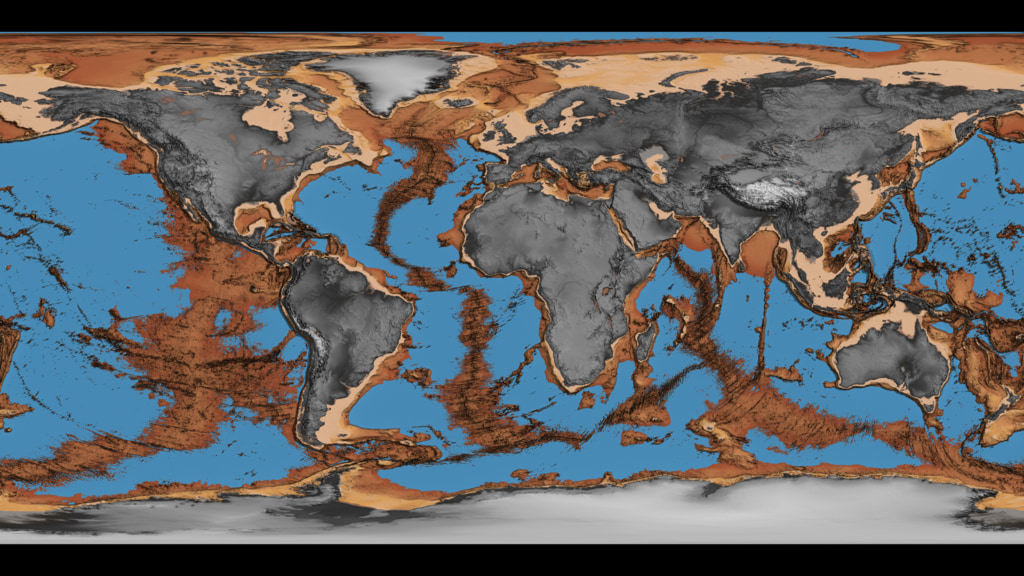
Three fifths of the Earth's surface is under the ocean, and the ocean floor is as rich in detail as the land surface with which we are familiar. This animation simulates a drop in sea level that gradually reveals this detail. As the sea level drops, the continental shelves appear immediately. They are mostly visible by a depth of 140 meters, except for the Arctic and Antarctic regions, where the shelves are deeper. The mid-ocean ridges start to appear at a depth of 2000 to 3000 meters. By 6000 meters, most of the ocean is drained except for the deep ocean trenches, the deepest of which is the Marianas Trench at a depth of 10,911 meters.
Animation of the draining of the Earth's oceans. The first frame indicates no decrease and the second frame drains all water above sea level. Each subsequent frame represents a 10 meter drop in the level of the Earth's oceans. The high resolution frames labeled 'Mask' can be used with the individual images below to create higher resolution versions of this animation.
This product is available through our Web Map Service.
Animation of ocean draining with sea level annotation.
This product is available through our Web Map Service.
This video is also available on our YouTube channel.

Shaded relief image of the Earth's topography and bathymetry
This product is available through our Web Map Service.
Next Generation Blue Marble image for July subsampled to match the shaded relief map.
This product is available through our Web Map Service.
Land-sea mask matching the Blue Marble image above.
This product is available through our Web Map Service.
Credits
Please give credit for this item to:
NASA/Goddard Space Flight Center Scientific Visualization Studio
U.S. Department of Commerce, National Oceanic and Atmospheric Administration, National Geophysical Data Center, 2006, 2-minute Gridded Global Relief Data (ETOPO2v2) - http://www.ngdc.noaa.gov/mgg/fliers/06mgg01.html
The Blue Marble Next Generation data is courtesy of Reto Stockli (NASA/GSFC) and NASA's Earth Observatory.
-
Animator
- Horace Mitchell (NASA/GSFC)
Missions
This page is related to the following missions:Datasets used
-
BMNG (Blue Marble: Next Generation) [Terra and Aqua: MODIS]
ID: 508Credit: The Blue Marble data is courtesy of Reto Stockli (NASA/GSFC).
This dataset can be found at: http://earthobservatory.nasa.gov/Newsroom/BlueMarble/
See all pages that use this dataset -
ETOPO2 (2-minute Gridded Global Relief Data)
ID: 651
Note: While we identify the data sets used on this page, we do not store any further details, nor the data sets themselves on our site.
Newer Versions
- ID: 4823
 Visualization
Release date
This page was originally published on Sunday, June 1, 2008.
This page was last updated on Wednesday, May 3, 2023 at 1:55 PM EDT.