2005 Sea Ice over the Arctic derived from AMSR-E
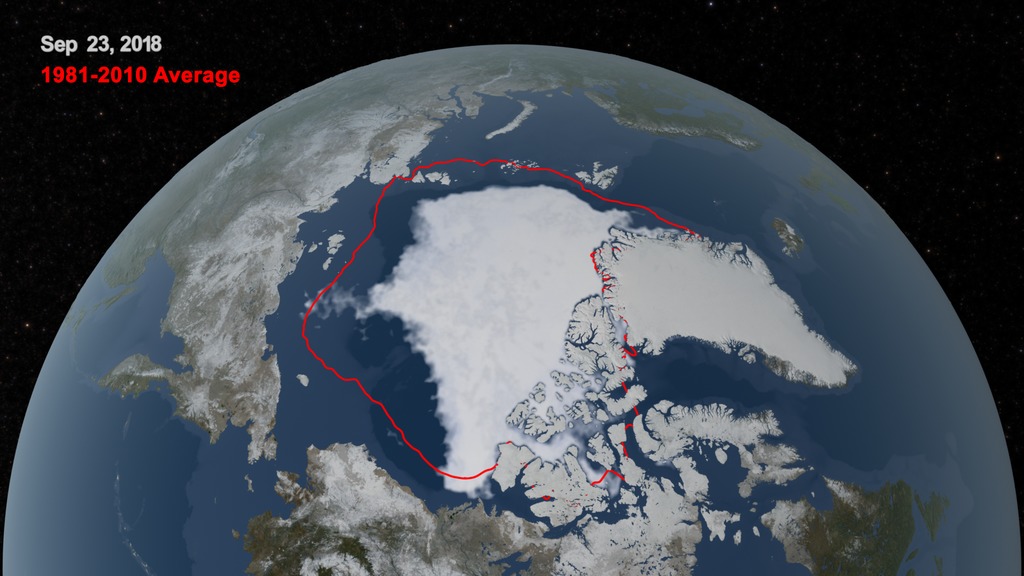
This animation shows the Spring retreat and subsequent Autumn advance of sea ice over the Arctic from 1/1/2005 through 12/31/2005. The false color of the sea ice, derived from the AMSR-E 6.25 km brightness temperature, was designed to highlight the fissures in the sea ice. Moving 3-day minimum brightness temperatures provide a background for smooth ice movement over which the actual daily brightness temperatures were mapped for definition of the ice structures. The sea ice extent was defined by a 3-day moving average of the AMSR-E 12.5 km sea ice concentration, showing as ice all areas having a sea ice concentration greater than 15%.
This animation shows the motion of the sea ice over the Arctic from 1/1/2005 through 12/31/2005.
This product is available through our Web Map Service.

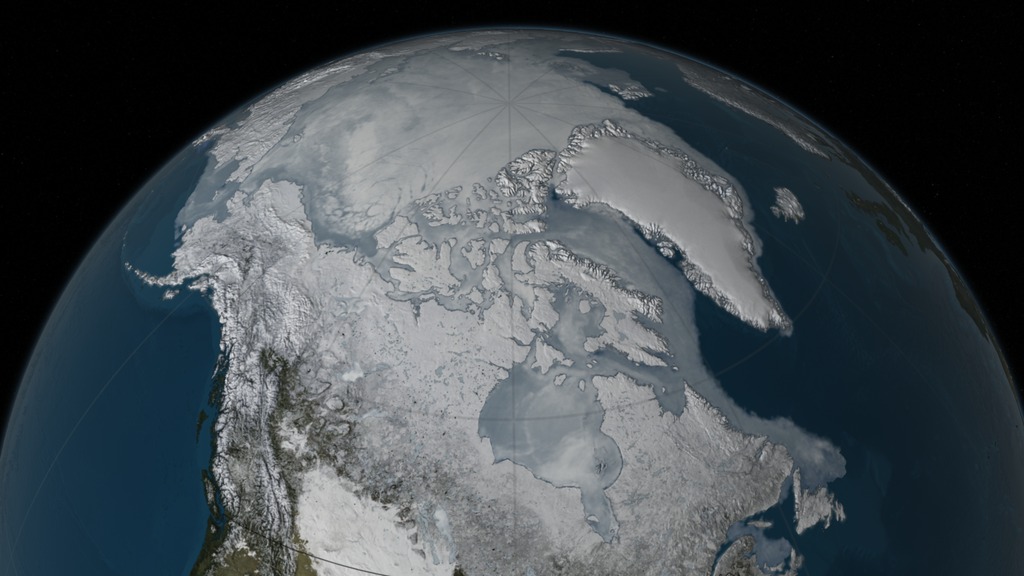
This image shows sea ice over the Arctic on March 11,2005.
Credits
Please give credit for this item to:
NASA/Goddard Space Flight Center Scientific Visualization Studio
-
Visualizer
-
Cindy Starr
(Global Science and Technology, Inc.)

-
Cindy Starr
(Global Science and Technology, Inc.)
-
Scientist
- Waleed Abdalati (NASA/HQ)
Datasets used
-
Daily L3 6.25 km 89 GHz Brightness Temperature (Tb) [Aqua: AMSR-E]
ID: 236 -
Sea Ice Concentration (Daily L3 12.5km Tb, Sea Ice Concentration, and Snow Depth) [Aqua: AMSR-E]
ID: 237
Note: While we identify the data sets used on this page, we do not store any further details, nor the data sets themselves on our site.
Related
- ID: 4684
 Visualization
 - ID: 4440
 Visualization
 - ID: 4355
 Visualization
Release date
This page was originally published on Monday, January 30, 2006.
This page was last updated on Wednesday, May 3, 2023 at 1:55 PM EDT.