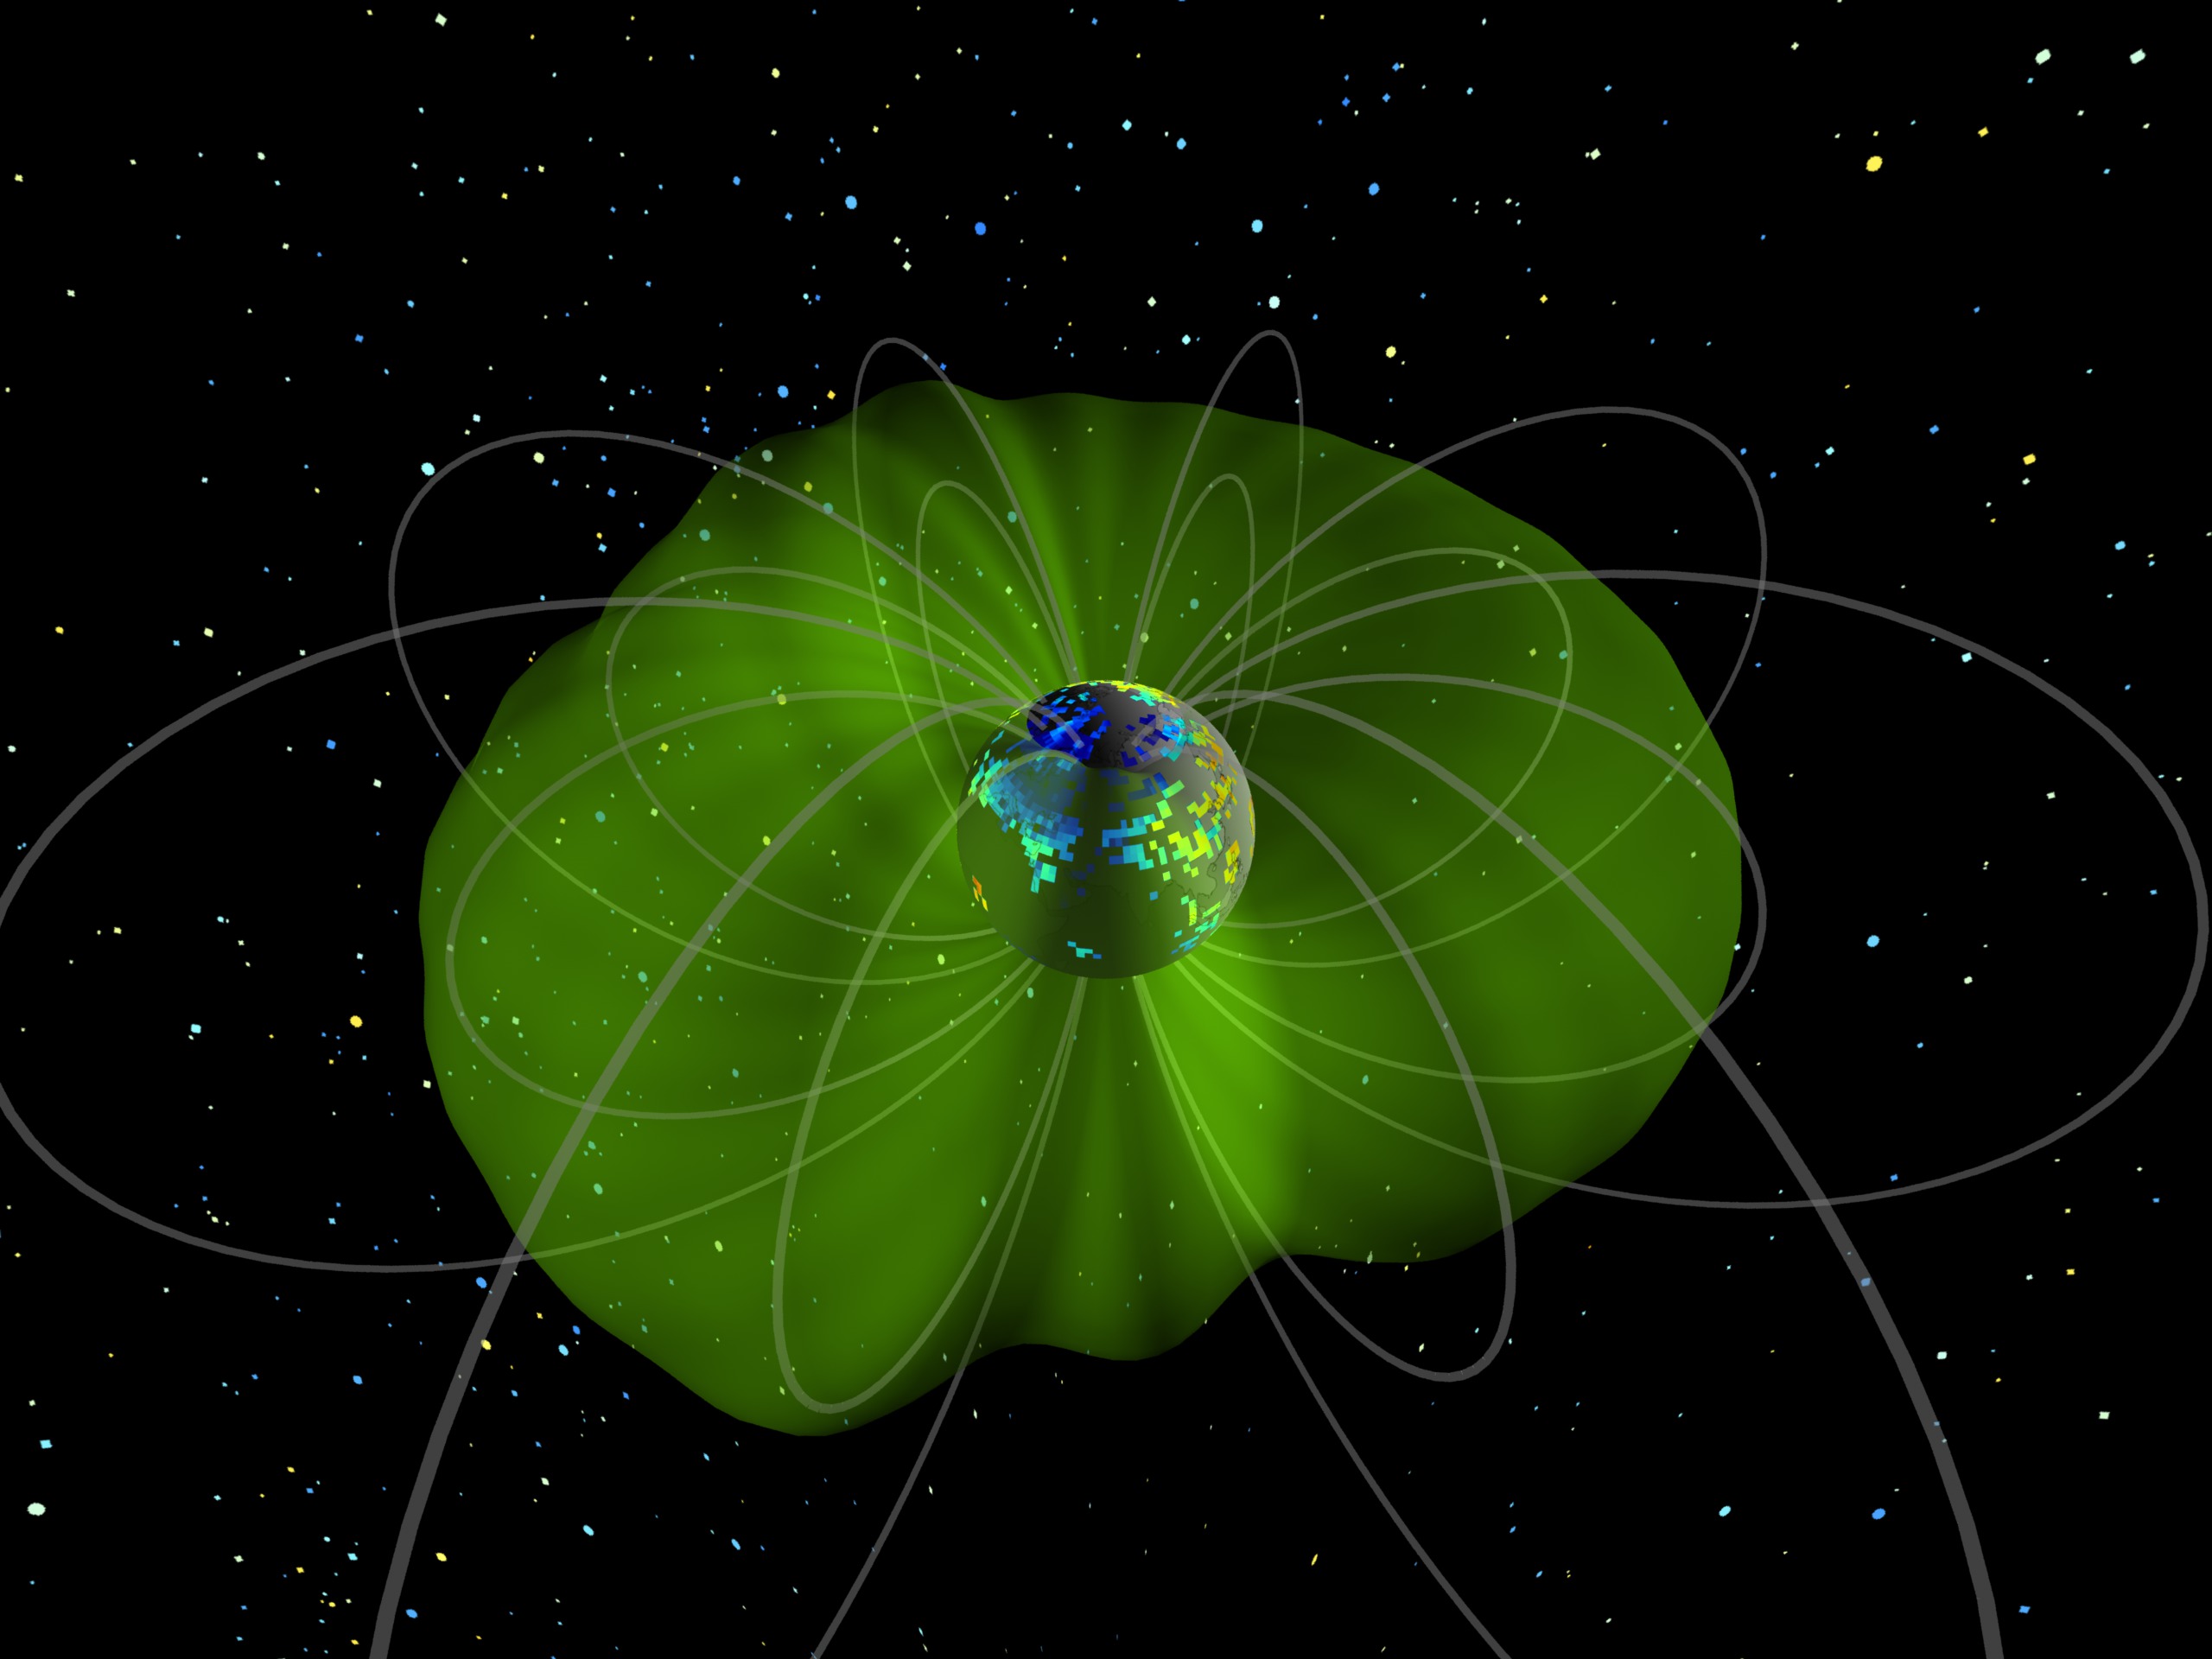
Ionosphere Total Electron Content - April 2001
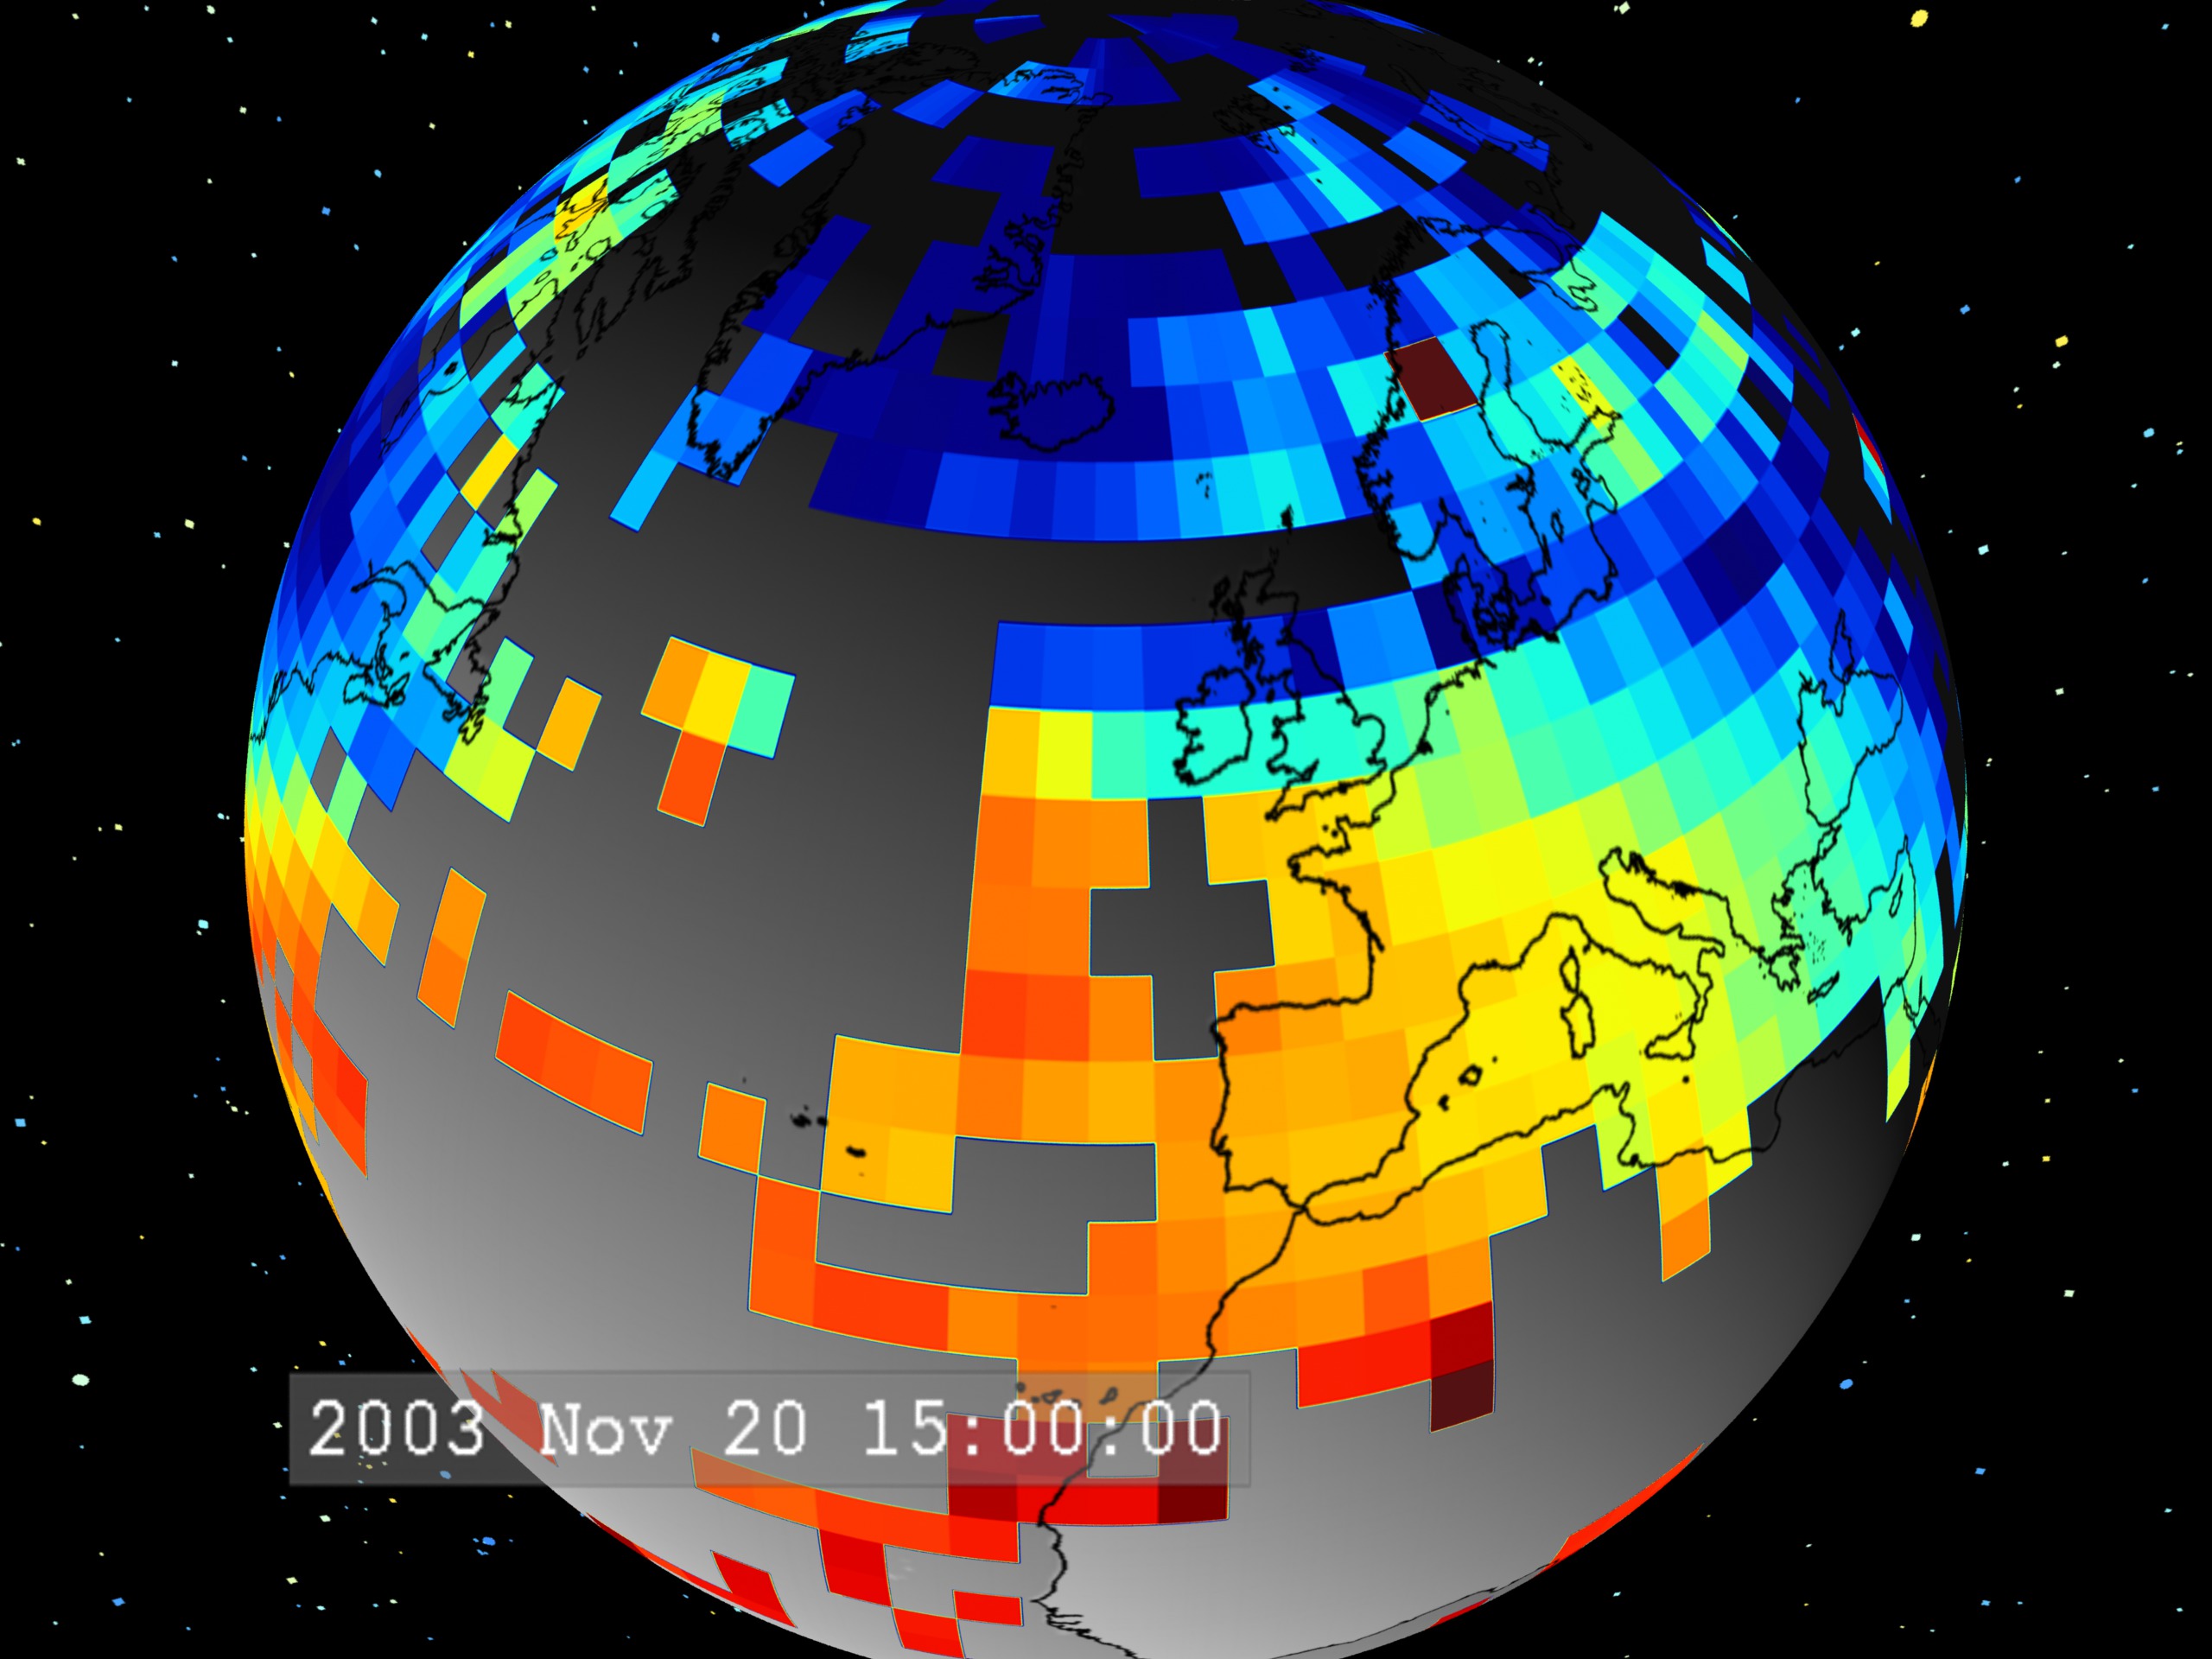
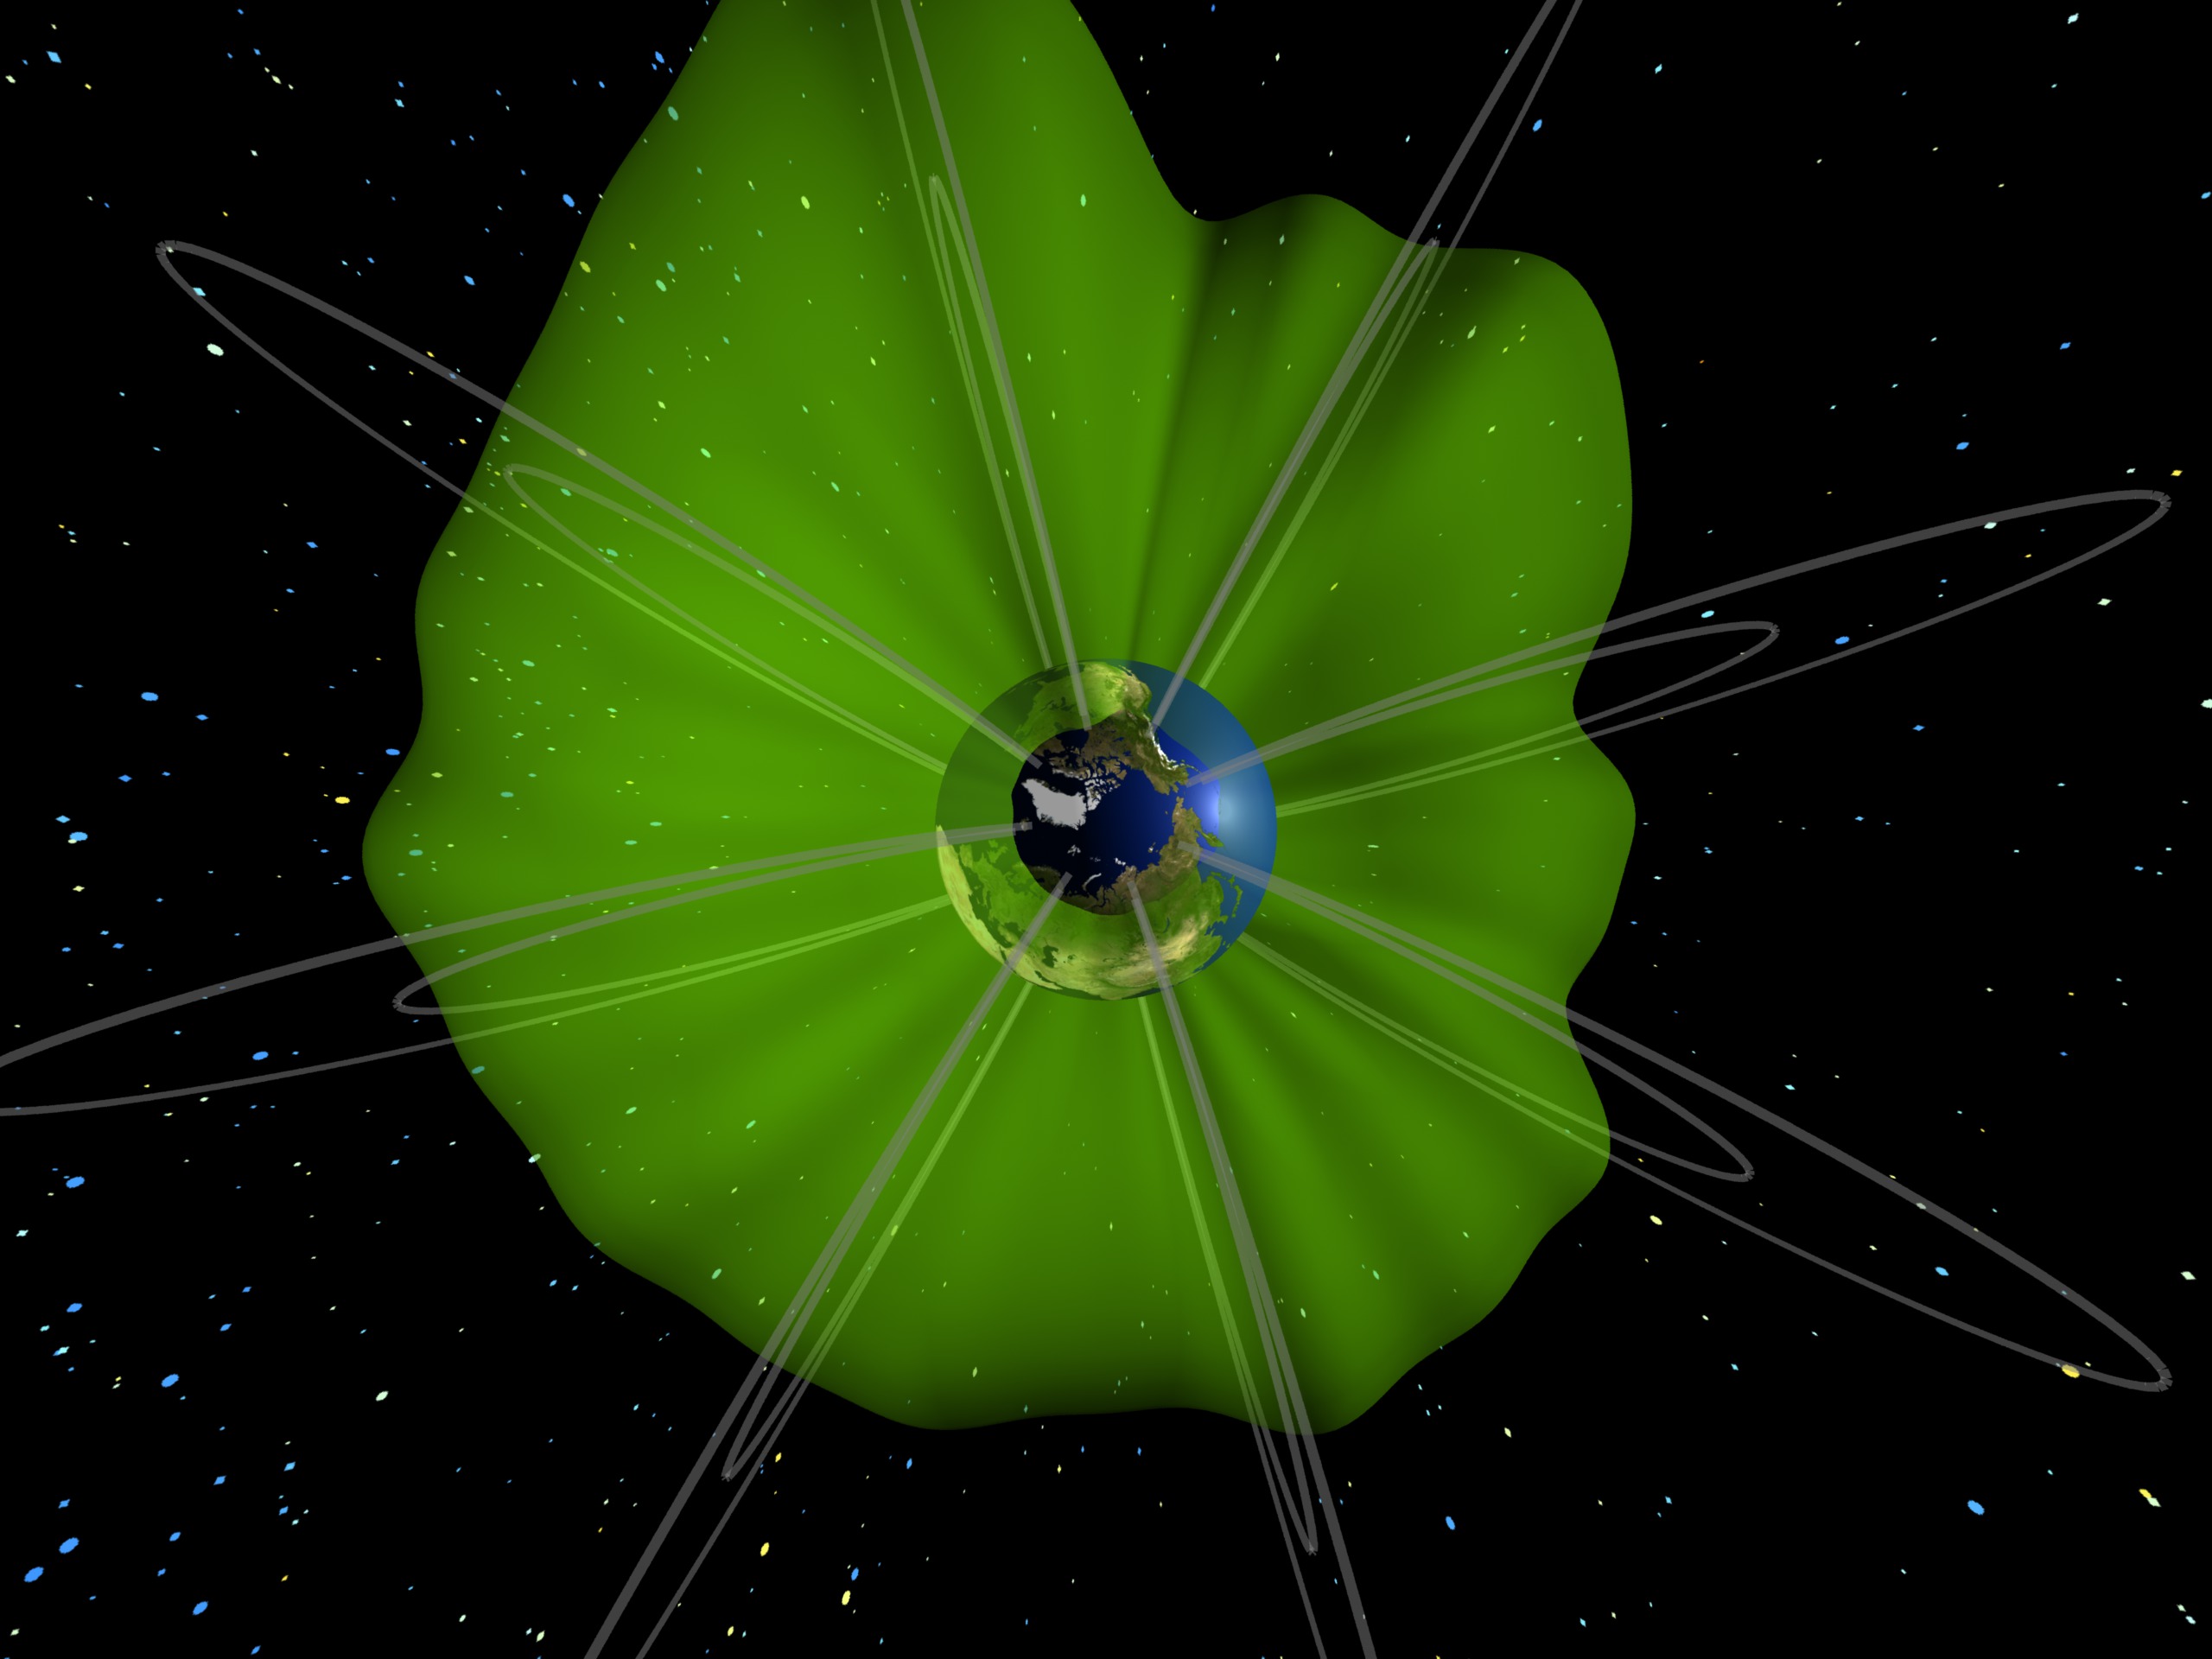
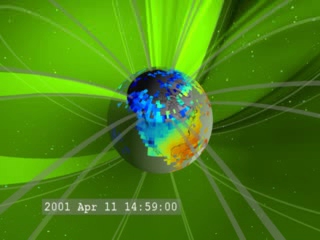
A view of the ionospheric Total Electron Content (TEC) measured over North America during a storm in April 2001. Red is high electron counts, blue is low, gray where there is no data. From the pre-storm state, we see relatively low electron counts. As the storm intensity increases, so do the number of electrons. The increase will generate more interference for communications systems, GPS, etc.
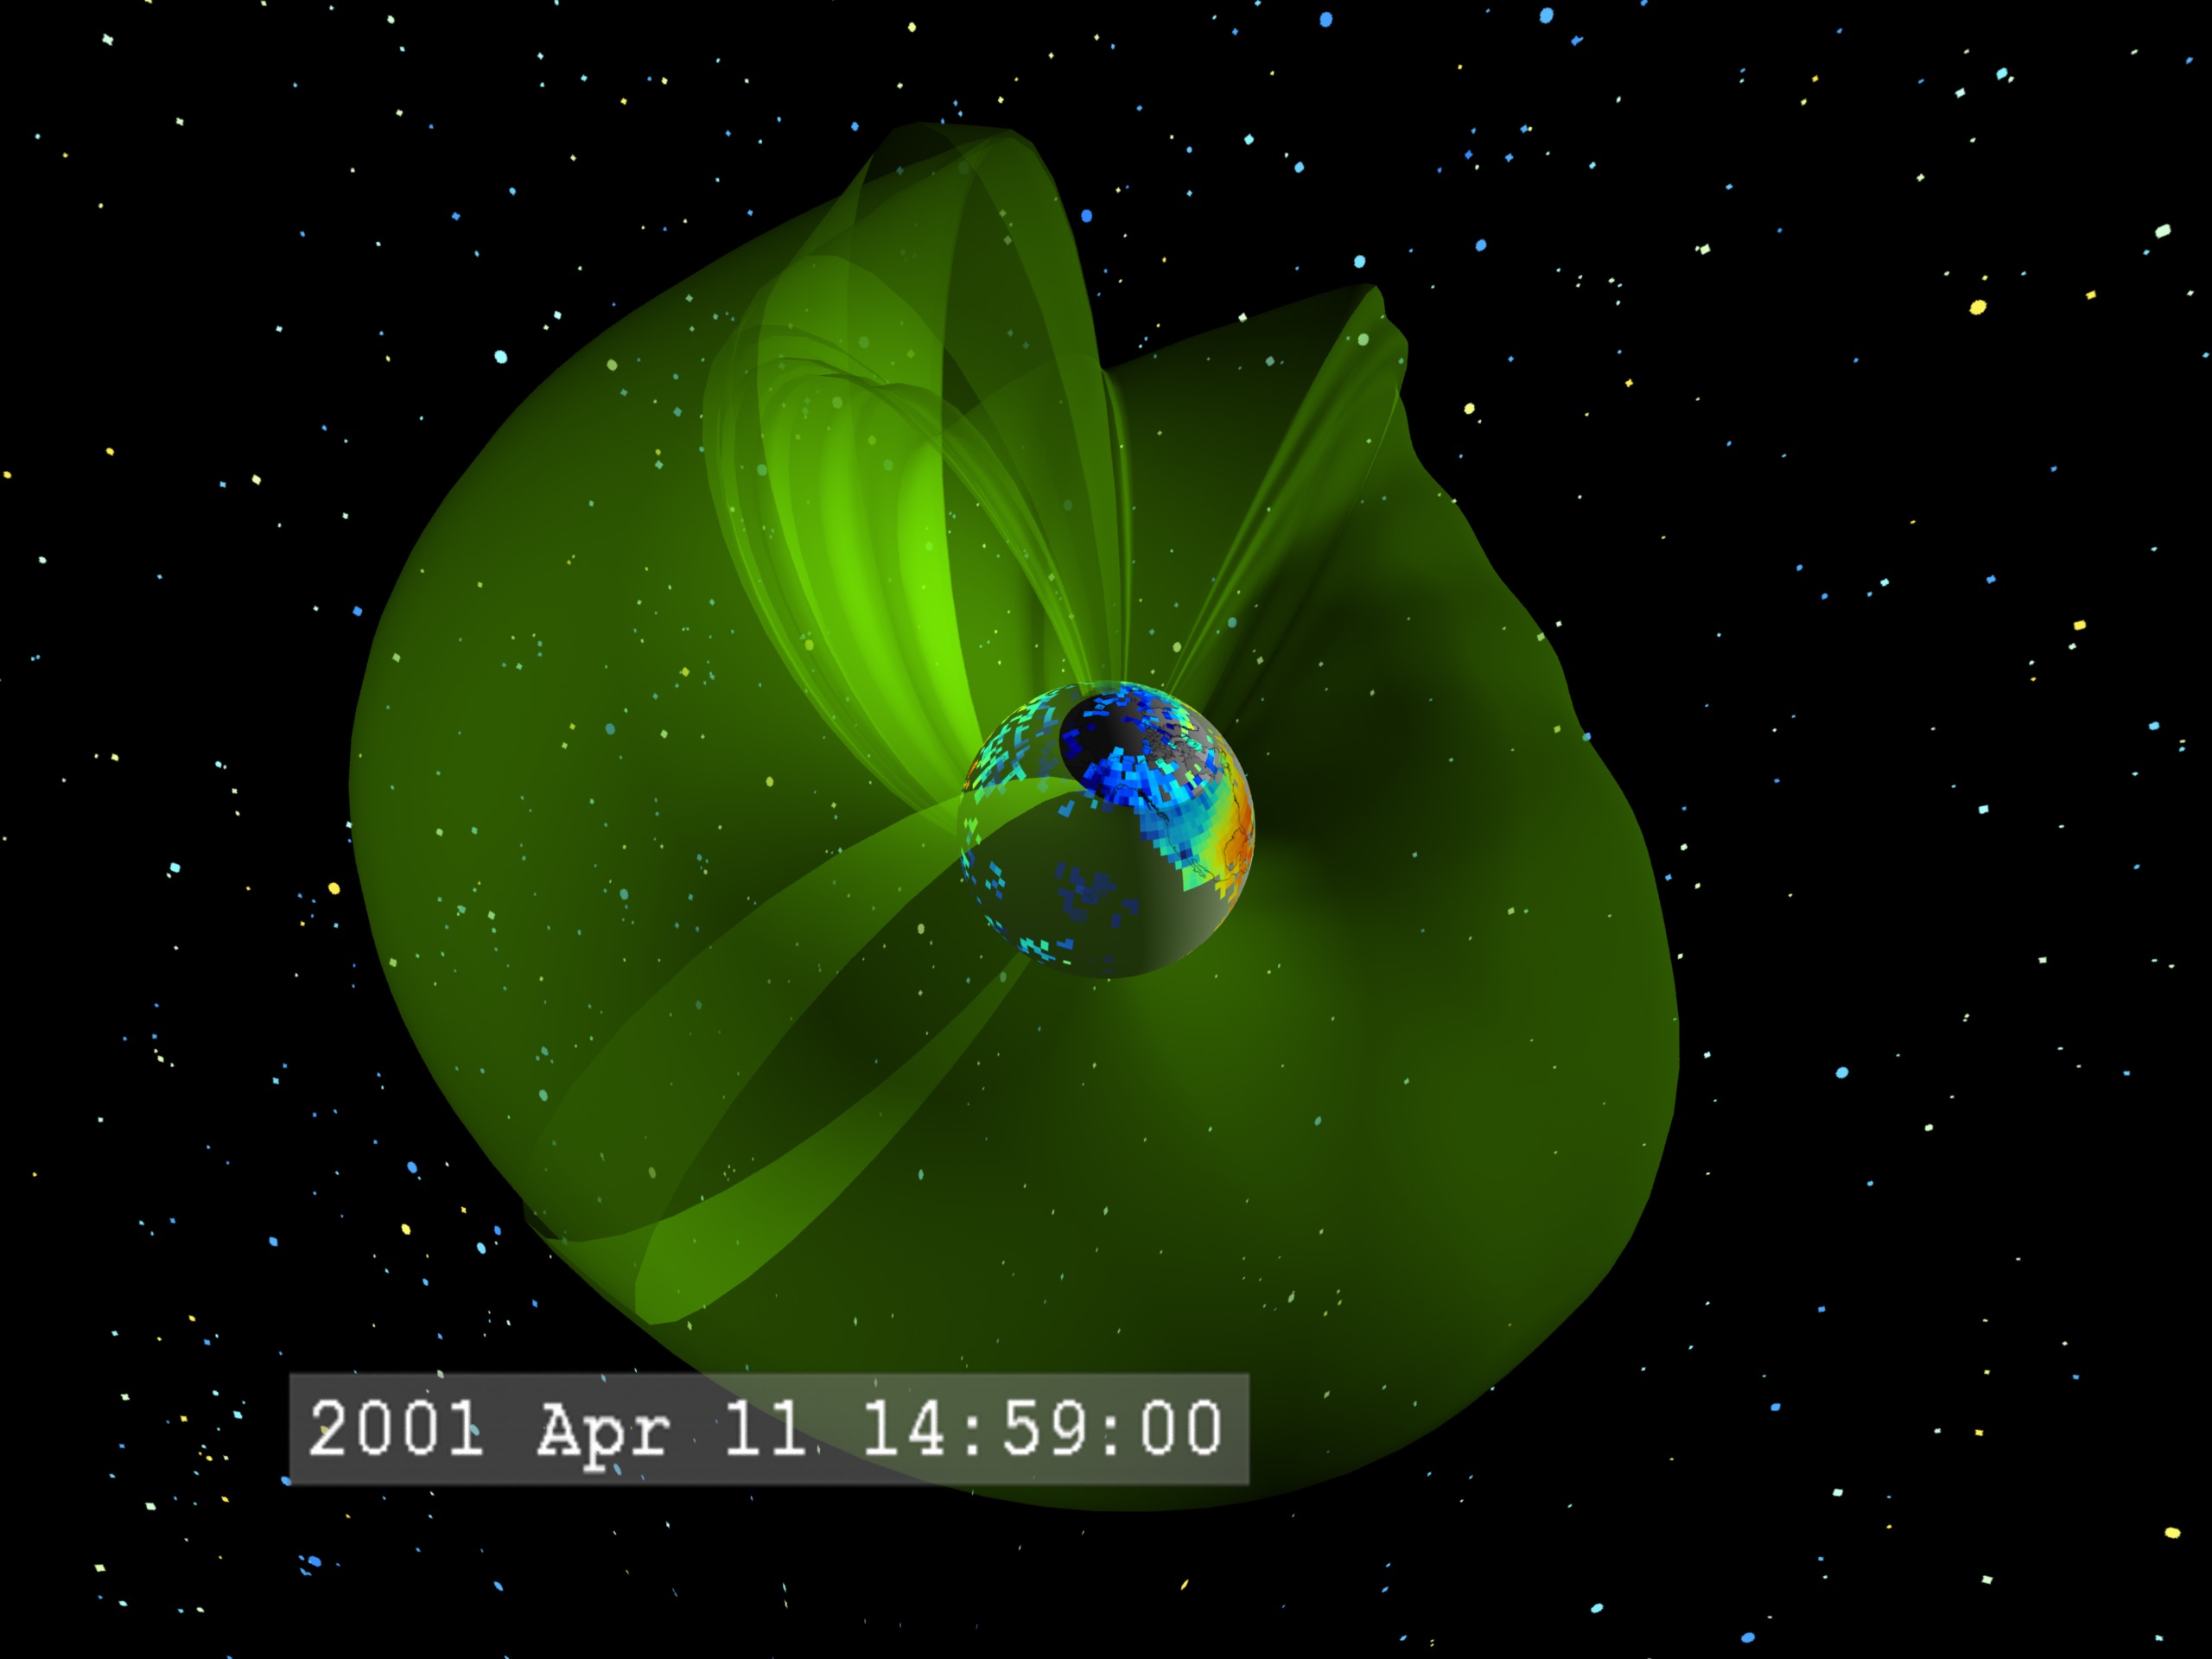
Closeup view of TEC data over North America, with dates
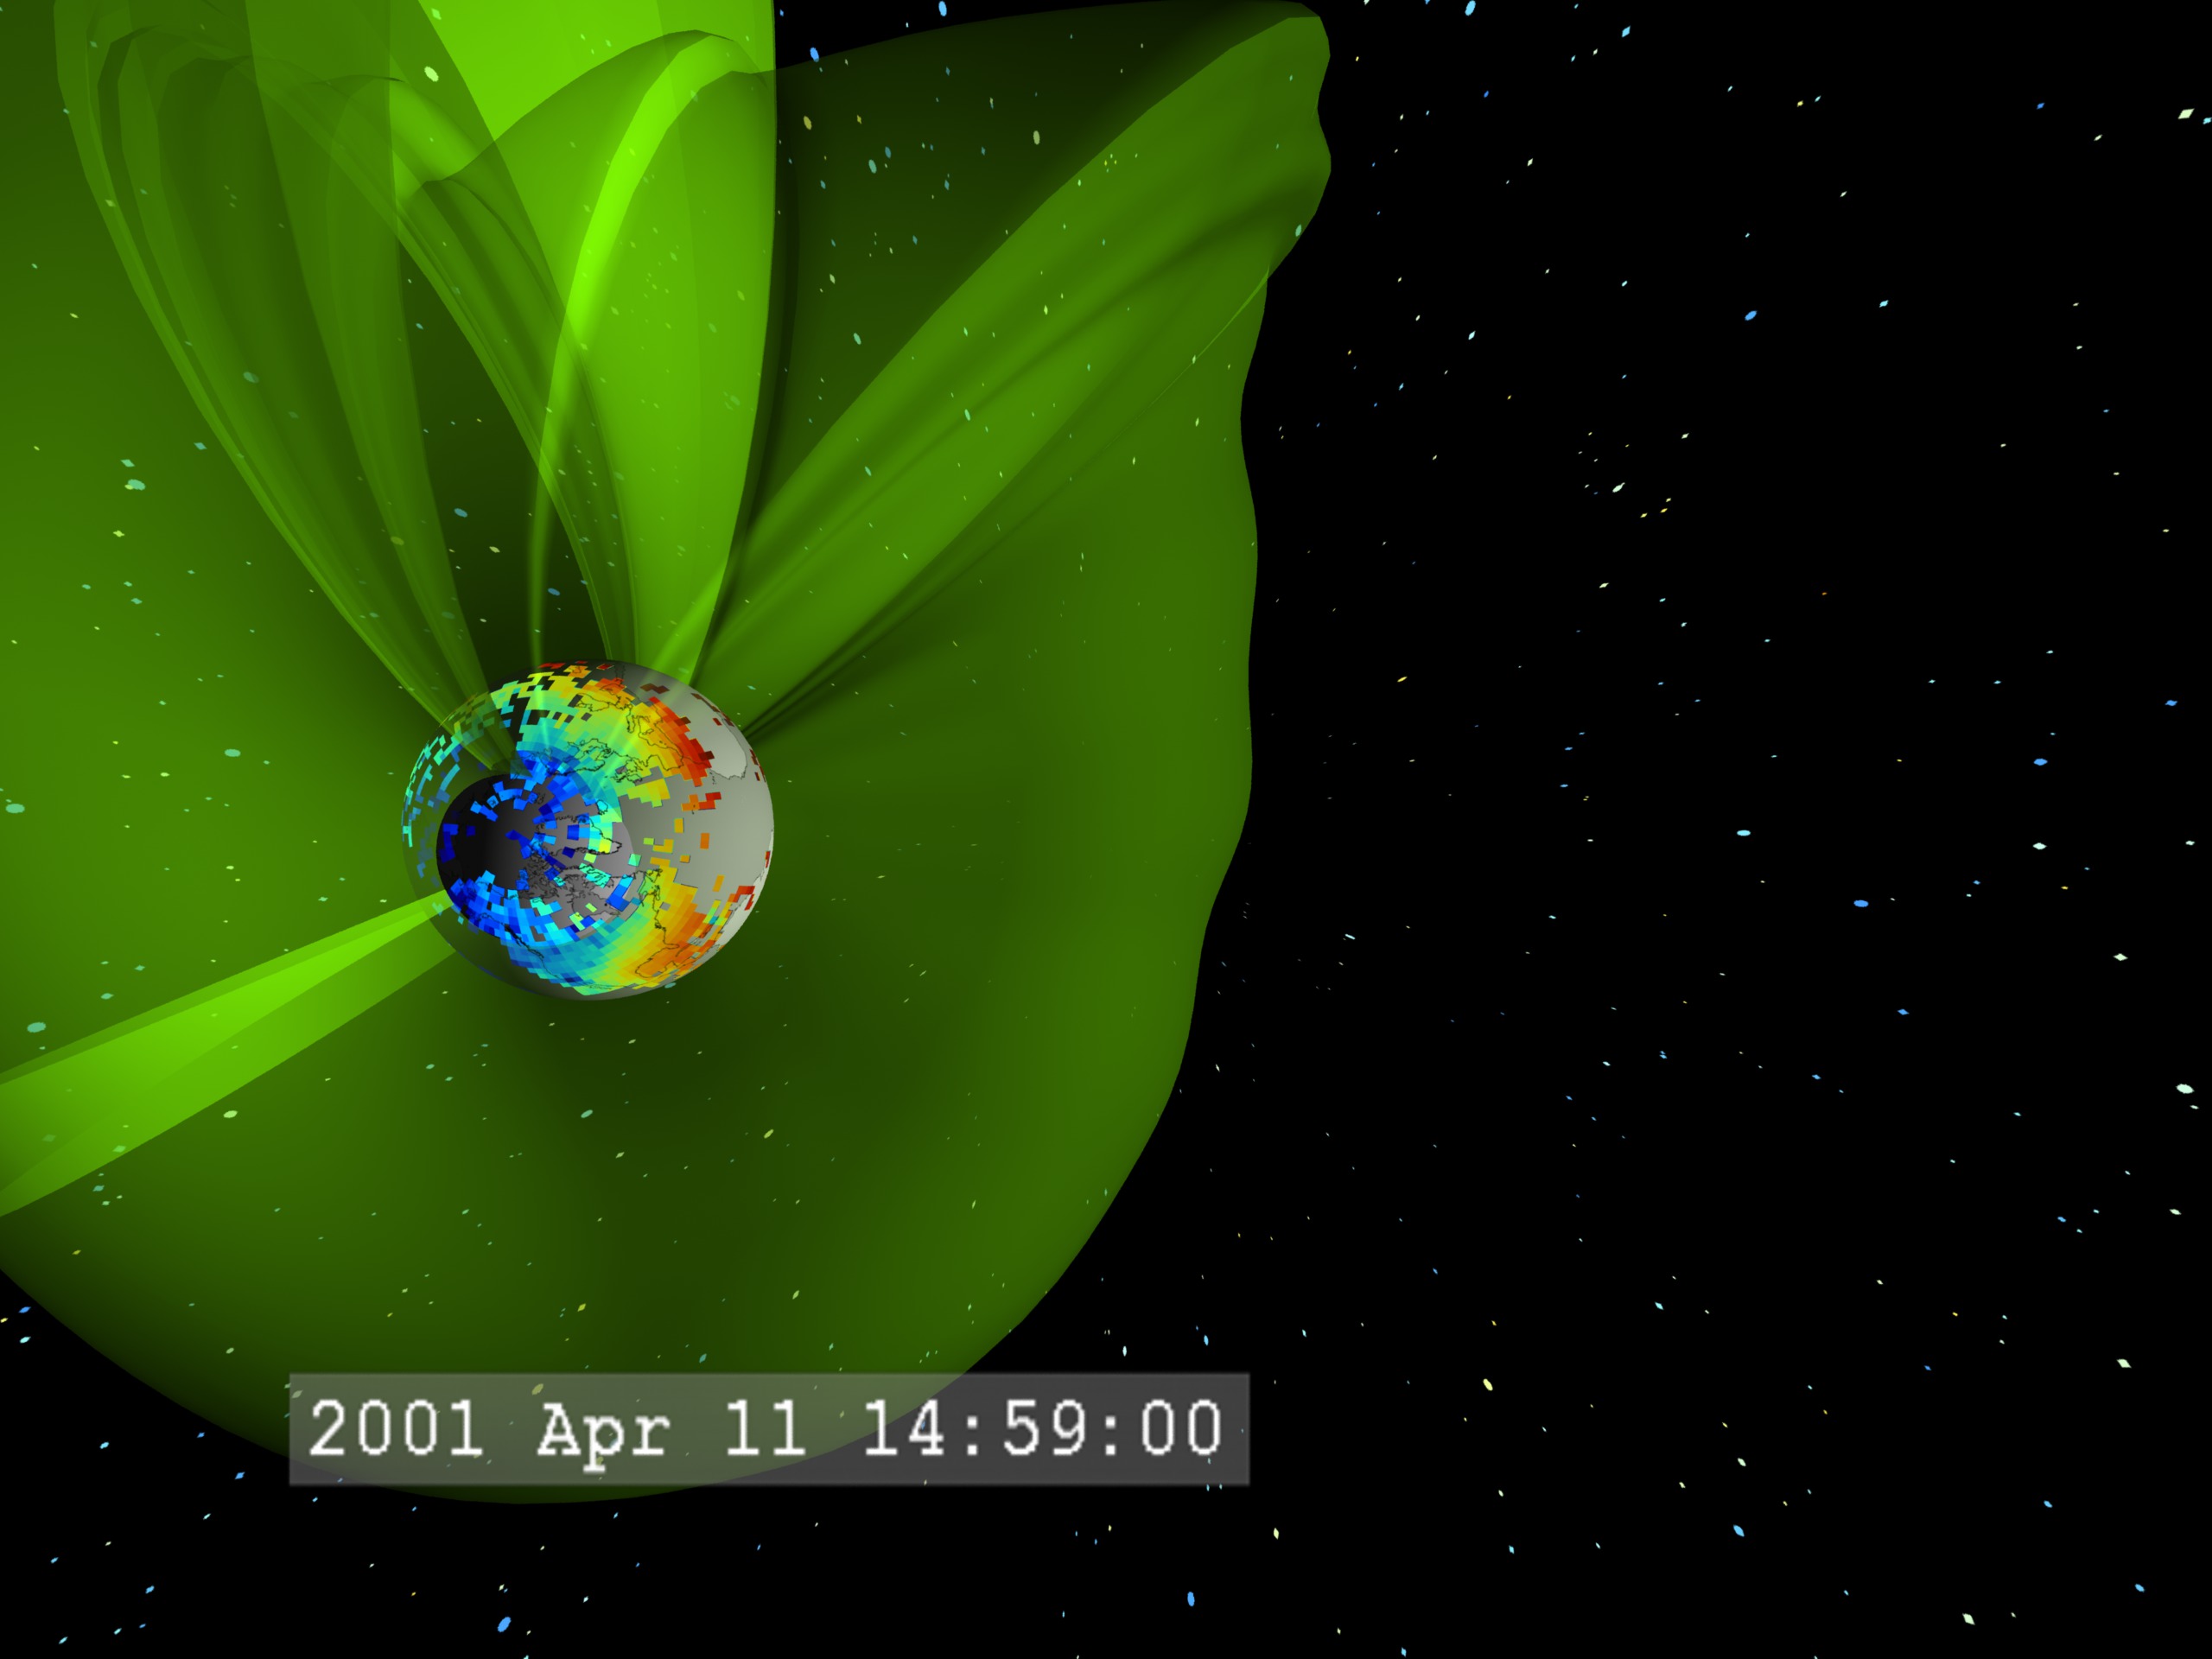
Closeup view of TEC data over North America, without dates

Pre-storm ionospheric electron content.
The high electron density plume (dark red) sweeps over the U.S and Canada.
For More Information
Credits
Please give credit for this item to:
NASA/Goddard Space Flight Center Scientific Visualization Studio
-
Animator
- Tom Bridgman (Global Science and Technology, Inc.)
-
Scientists
- Anthea J. Coster (MIT/Haystack)
- John Foster (MIT/Haystack)
- Robert Robinson (NSF)
- Marlene Colerico (MIT/Haystack)
Series
This page can be found in the following series:Related papers
JOURNAL OF GEOPHYSICAL RESEARCH, VOL. 110, A09S31, doi:10.1029/2004JA010928, 2005
JOURNAL OF GEOPHYSICAL RESEARCH, VOL. 110, A09S31, doi:10.1029/2004JA010928, 2005
Datasets used
-
Total Electron Content (TEC) [NAVSTAR: World-wide GPS Receiver Network]
ID: 580This dataset can be found at: http://www.navcen.uscg.gov/GPS/geninfo/
See all pages that use this dataset
Note: While we identify the data sets used on this page, we do not store any further details, nor the data sets themselves on our site.
Related
- ID: 3311
- ID: 3312
- ID: 3313
 Visualization
 - ID: 3314
 Visualization
 - ID: 3315
 Visualization
 - ID: 3316

- ID: 3317
Release date
This page was originally published on Monday, December 5, 2005.
This page was last updated on Wednesday, May 3, 2023 at 1:55 PM EDT.