The Earth System Science Spheres
Atmosphere - Biosphere - Cryosphere - Geosphere - Hydrosphere
Like parts of the human body, Earth’s “spheres” interact with one another in complex ways. To understand Earth as an integrated system, NASA collaborates with its domestic and international partners to support satellite missions and field campaigns that measure key Earth processes across different places and times of year.
A rotating Earth with datasets representing the four of the five Earth System Science spheres. Atmosphere is represented by PACE true color, which shows clouds, biosphere is represented by PACE ocean color and land vegetation pigment, hydrophere is represented by SWOT river water height and sea surface height anomaly, and geosphere is represented by GRACE-FO mass anomaly.
A vertically oriented rotating Earth with datasets representing the four of the five Earth system Science spheres. Atmosphere is represented by PACE true color which shows clouds, biosphere is represented by PACE ocean color and land vegetation pigment, hydrophere is represented by SWOT river water height and sea surface height anomaly, and geosphere is represented by GRACE-FO mass anomaly.
PACE True Color
PACE true color image from September 24, 2024.
The clouds in this PACE OCI true color image from September 24, 2024 are a visible representation of the atmosphere, one of five Earth Systen Science spheres. NASA studies the dynamics and thermodynamics of the atmosphere, its physical and chemical composition, and the interdependent impacts that these have on the Earth’s radiative balance, air quality, and weather.
Credits for data used for this globe:
PACE OCI Level-2 Regional Surface Reflectance Data, version 3.1 doi.org/10.5067/PACE/OCI/L2/SFREFL/3.1 with VIIRS/NPP Imagery L1B Swaths filling in gaps doi.org/10.5067/VIIRS/VNP02IMG.002
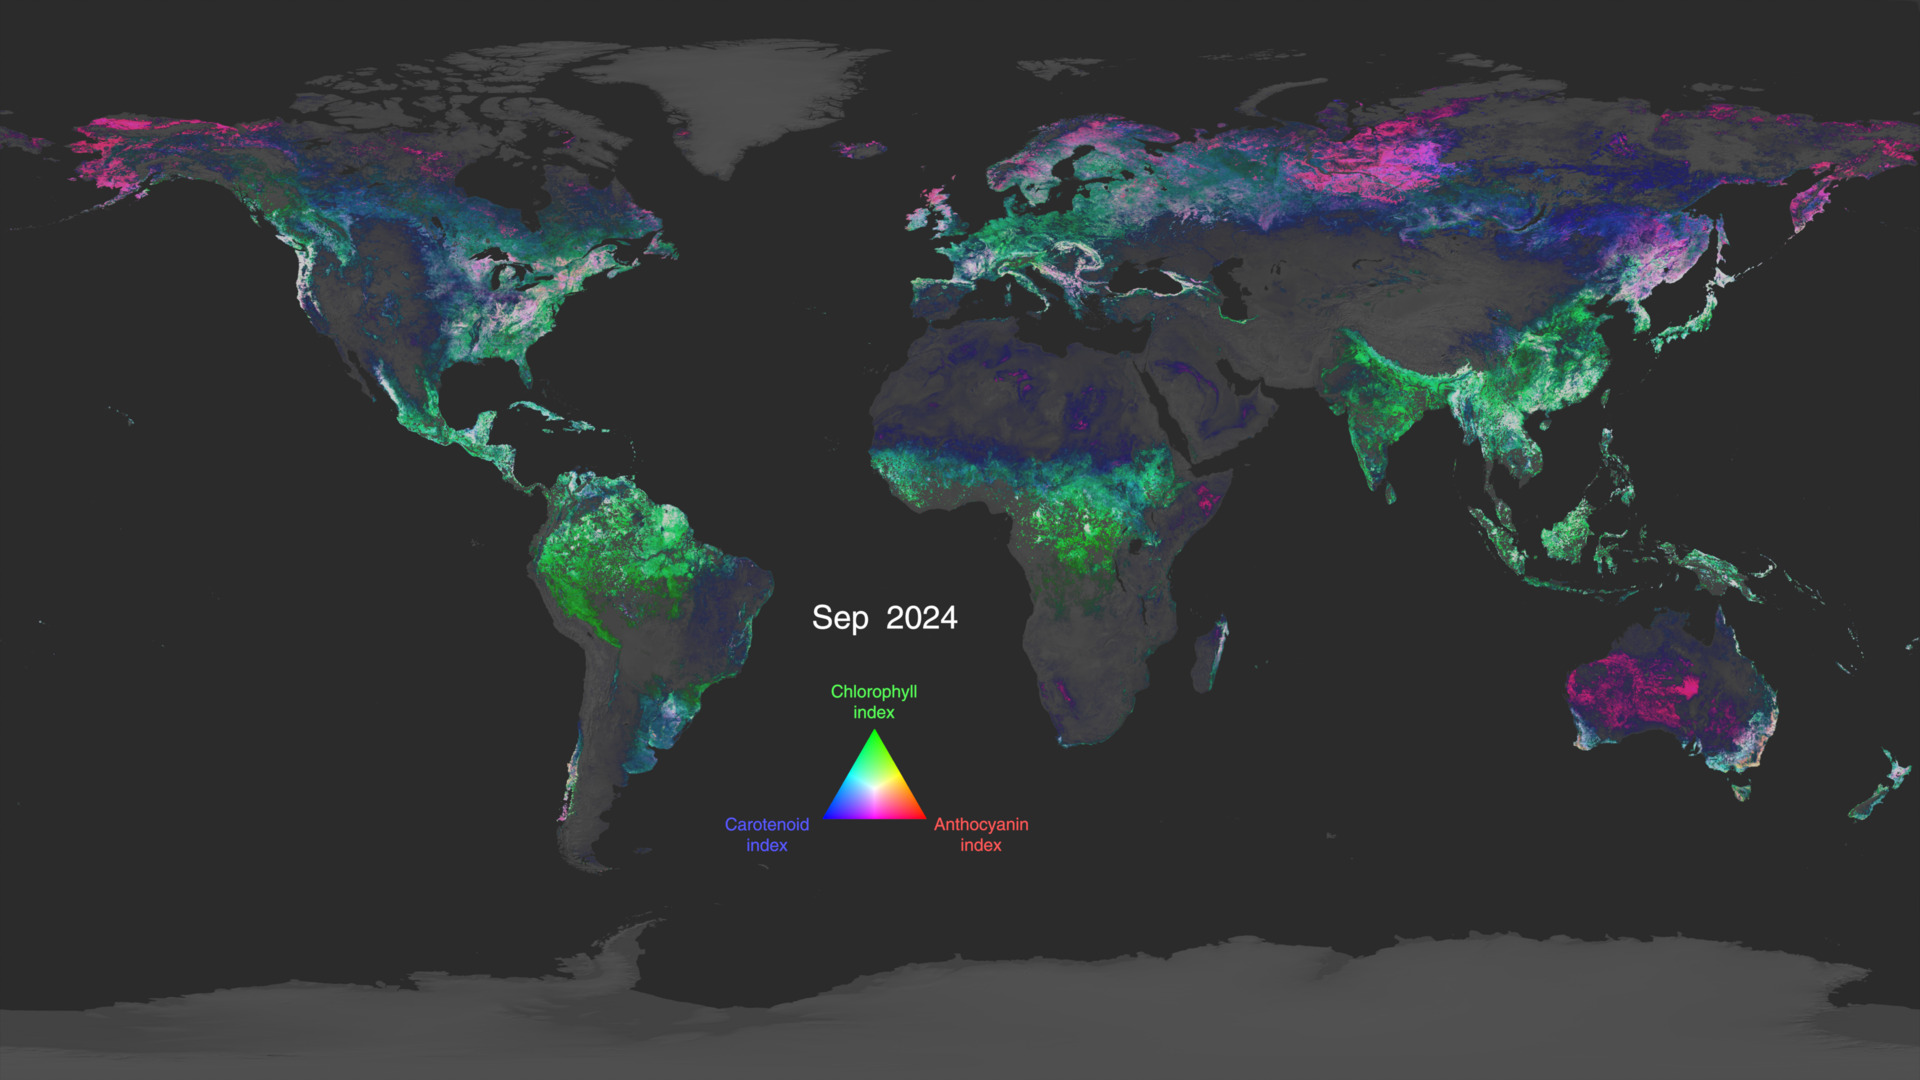
PACE Biosphere
PACE chlorophyll concentration showing the location of phytoplankton in the oceans, and the three major classes of plant pigments on land represent the biosphere. NASA's biosphere studies investigate the interactions between and within terrestrial and aquatic ecosystems, along with changes in their biogeochemistry and biodiversity. The goal is to detect and predict natural and human-induced changes in living systems to sustain the services they provide and ensure planetary health for future generations
Credits for data used for this globe:
Land: Color image from NASA/GSFC svs.gsfc.nasa.gov/5548/ of PACE OCI Vegetation Indices (LANDVI) doi.org/10.5067/8L77O0Y8GHV8
Ocean: PACE OCI Level-3 Global Mapped Chlorophyll (CHL) Data, version 3.1 doi.org/10.5067/PACE/OCI/L3M/CHL/3.1
SWOT Hydrosphere
The hydrosphere is represented by SWOT river surface elevation on land and sea surface heigh anomaly on the ocean. Studies of the hydrosphere encompass observation, understanding, and prediction of the distribution and movement of water in the Earth System. Specifically, NASA Hydrosphere studies water and energy cycles across land, ocean, and the atmosphere.
Credits for data used for this globe:
Oceans: The SWOT L3_LR_SSH product, derived from the L2 SWOT KaRIn low rate ocean data products (NASA/JPL and CNES), is produced and made freely available by AVISO and DUACS teams as part of the DESMOS Science Team project. AVISO/DUACS, 2024. SWOT Level-3 KaRIn Low Rate SSH Expert (v3.0) [Data set]. CNES. doi.org/10.24400/527896/A01-2023.018
Rivers: The SWOT_L2_HR_RiverAvg_D product; Surface Water Ocean Topography (SWOT). 2025. SWOT Level 2 River Cycle-Averaged Data Product, Version D. Ver. D. PO.DAAC, CA, USA. doi.org/10.5067/SWOT-RIVERAVG-D and the SWOT River Database (SWORD) v17b Altenau et al., (2021) The Surface Water and Ocean Topography (SWOT) Mission River Database (SWORD): A Global River Network for Satellite Data Products. Water Resources Research. doi.org/10.5281/zenodo.3898569
Shaded relief: Made with Natural Earth. naturalearthdata.com
GRACE-FO Mass Anomaly
GRACE-FO surface mass anomalies represent the Geosphere. GRACE-FO measures large-scale changes in Earth's gravity field - enabling it to track changes caused by the movement of water and ice, as well as chages in the geoid's shape caused by movement of magma and changes in the mantle. NASA's Geosphere missions study processes and changes in the Earth’s core, mantle, and crust along with surface topography, composition, and geology, as well as the hazards they generate.
Credits for data used for this globe:
Land: GRACE-FO, F. L. (2024). JPL TELLUS GRACE-FO Level-3 Monthly Land Water-Equivalent-Thickness Surface Mass Anomaly Release 6.3 version 04 [Data set]. NASA Physical Oceanography Distributed Active Archive Center. doi.org/10.5067/GFLND-3J634
Ocean: GRACE-FO, F. L. (2024). JPL TELLUS GRACE-FO Level-3 Monthly Ocean Bottom Pressure Anomaly Release 6.3 version 04 [Data set]. NASA Physical Oceanography Distributed Active Archive Center. doi.org/10.5067/GFOCN-3J634
Shaded relief: Blue Earth Bathymetry, an edited version of GEBCO (General Bathymetric Chart of the Oceans) www.shadedrelief.com/blue-earth/
Coastlines: Made with Natural Earth. naturalearthdata.com
Credits
NASA
See each individual globe above for dataset credits.
-
Visualizer
- Marit Jentoft-Nilsen (Global Science and Technology, Inc.)
Missions
This page is related to the following missions:Related
- ID: 14990
 Produced Video
Sources
- ID: 5548
 Visualization
Release date
This page was originally published on Sunday, March 1, 2026.
This page was last updated on Thursday, March 19, 2026 at 6:05 PM EDT.