Monitoring California Groundwater
GRACE California Terrestrial Water Storage from 2002-04 to 2023-03.
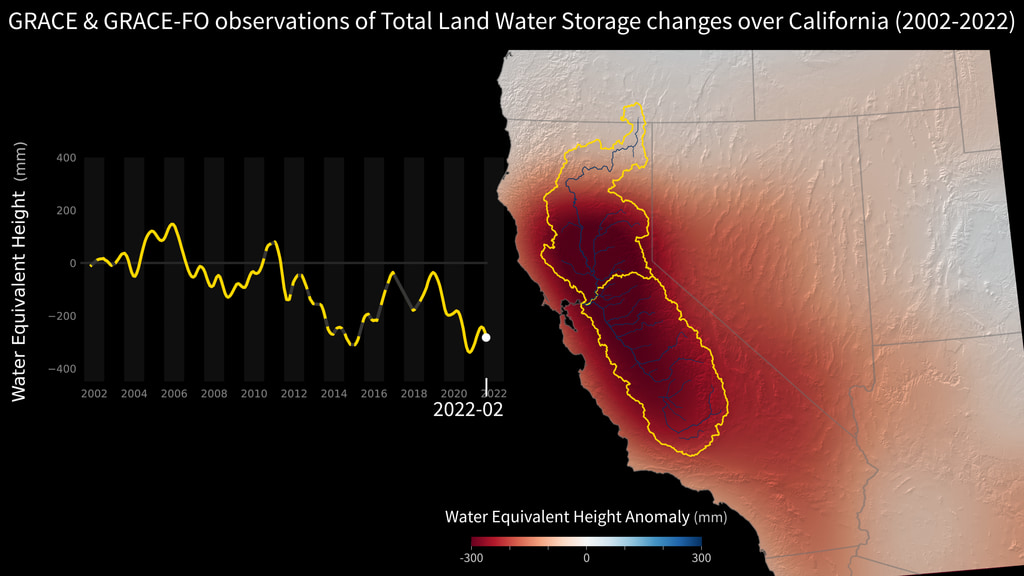
The joint U.S.-German Gravity Recovery and Climate Experiment (GRACE, 2002 - 2017) mission, and its successor GRACE Follow-On (launched in 2018), map month-to-month changes in Earth's gravity field resulting from the movement of mass, such as water, near the surface of the planet. This animation shows how the total amount of water (snow, surface water, soil moisture, and groundwater) varies in space and time, with the passage of dry seasons and wet seasons as well as with flooding, drought, and transport due to water management. Blue colors represent wetter than average conditions (relative to 2004-2010), while red colors represent drier than average conditions. The yellow line in the graph on the left shows the evolution of the month-to-month variations for the area outlined in yellow on the map.
The Sacramento, San Joaquin, and Tulare basins are outlined in yellow, and rivers and tributaries are shown as blue lines. The basins include California's Central Valley, the most productive agricultural region in the U.S. Repeated drought conditions and increased water use in California have led to a long-term decline of terrestrial water, interspersed with above-average precipitation periods (e.g., 2015/2016) that have allowed some recovery of the land water storage.
GRACE California Terrestrial Water Storage from 2018-06 to 2023-03.
For More Information
Credits
Please give credit for this item to:
NASA/JPL-Caltech
-
Scientist
- Felix W. Landerer (NASA/JPL CalTech)
-
Animator
- Marit Jentoft-Nilsen (Global Science and Technology, Inc.)
Missions
This page is related to the following missions:Datasets used
-
TWS Anomaly (Terrestrial Water Storage Anomaly) [Gravity Recovery and Climate Experiment (GRACE)]
ID: 889 -
GRACE Follow-On (Terrestrial Water Storage Anomaly) [Gravity Recovery and Climate Experiment (GRACE) Follow-On]
ID: 1078
Note: While we identify the data sets used on this page, we do not store any further details, nor the data sets themselves on our site.
Older Versions
- ID: 31177
 Hyperwall Visual
Release date
This page was originally published on Wednesday, June 7, 2023.
This page was last updated on Monday, March 3, 2025 at 12:48 AM EST.