Analyzing Superstorm Sandy
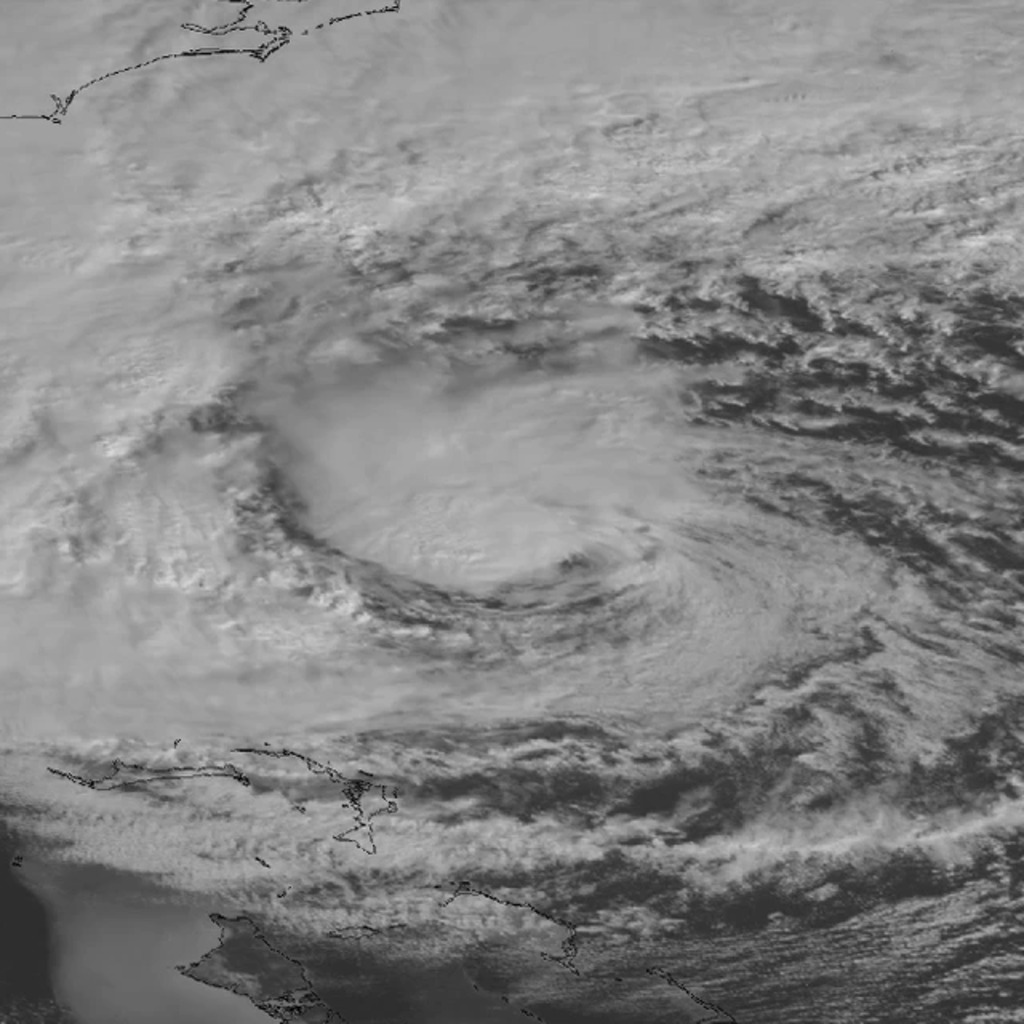
A rare convergence of environmental conditions during Hurricane Sandy’s lifecycle led to a storm of unforgettable destruction—hence its nickname, Superstorm Sandy. Scientists can analyze the structure and lifecycle of severe storms like Sandy using weather prediction models and incorporate what they learn into newer models, which hopefully result in even more accurate hurricane forecasts in the future. Scientists at NASA used the Goddard Earth Observing System Model, Version 5 (GEOS-5) to simulate surface wind speeds across the Atlantic during Sandy’s lifecycle. The large image above shows surface wind speeds on October 29, 2012, as simulated by the GEOS-5 at 7-kilometer (~4.3-mile) resolution just before the storm made landfall near Atlantic City, New Jersey. Wind speeds range from approximately 10 miles per hour (15 kilometers per hour), shown as dark blue, to 80 miles per hour (130 kilometers per hour), shown as very light purple. In the days following landfall, the remnants of Sandy moved inland over Northern New England and Canada before finally dissipating. The three smaller images show how GEOS-5 simulations of sea level pressure [left], surface wind speeds [center], and accumulated rainfall amounts [right] from October 26, 2012 to October 31, 2012, compare to observations from the National Oceanic and Atmospheric Administration’s National Hurricane Center.
Used in 2014 Calendar.

GEOS-5 simulation of Hurricane Sandy's surface wind speeds, October 2012.
For More Information
See the following sources:
Credits
Please give credit for this item to:
NASA's Goddard Space Flight Center, Scientific Visualization Studio
-
Project support
- Mark Malanoski (Global Science and Technology, Inc.)
-
Writer
- Heather Hanson (Global Science and Technology, Inc.)
Series
This page can be found in the following series:Datasets used
-
GEOS Atmospheric Model
ID: 665
Note: While we identify the data sets used on this page, we do not store any further details, nor the data sets themselves on our site.
Related
- ID: 10083
 Produced Video
Release date
This page was originally published on Wednesday, October 30, 2013.
This page was last updated on Thursday, October 10, 2024 at 12:21 AM EDT.