Hurricane Georges from TRMM: September 27, 1998
This image was taken at 2:00 PM.
A fly-in to Hurricane Georges on September 27, 1998 at 2:00 PM, showing the three-dimensional structure of the precipitation as measured by the Precipitation Radar instrument on TRMM. In this animation, a surface of constant precipitation is colored by the value of the precipitation on the ground under the surface.

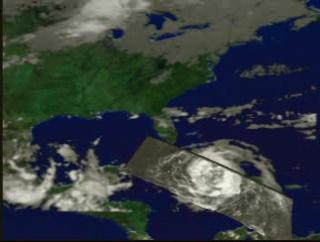
Precipitation rates on the ground superimposed on an cloud image of Hurricane Georges taken on September 27, 1998. Red represents regions of highest rainfall.
A perspective view of clouds and precipitation isosurfaces of Hurricane Georges, from September 27, 1998
A perspective view of clouds and precipitation isosurfaces of Hurricane Georges, from September 27, 1998
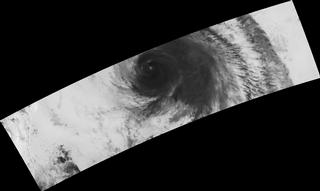
An image of Hurricane Georges taken by the VIRS instrument on TRMM on September 27, 1998
Video slate image reads "TRMM Hurricane Georges September 27, 1998 time 2:00pm EDT TRMM Microwave Image and Visible and Infrared Scanner (and GOES Satellite Data)".
Credits
Please give credit for this item to:
NASA/Goddard Space Flight Center
Scientific Visualization Studio
-
Animator
-
Greg Shirah
(NASA/GSFC)

-
Greg Shirah
(NASA/GSFC)
-
Scientist
- Chris Kummerow (NASA/GSFC)
Missions
This page is related to the following missions:Series
This page can be found in the following series:Datasets used
-
[GOES]
ID: 22 -
[TRMM: PR]
ID: 109 -
[TRMM: TMI]
ID: 110 -
[TRMM: VIRS]
ID: 111
Note: While we identify the data sets used on this page, we do not store any further details, nor the data sets themselves on our site.
Related
- ID: 214
 Visualization
 - ID: 215
 Visualization
Release date
This page was originally published on Thursday, December 31, 1998.
This page was last updated on Wednesday, May 3, 2023 at 1:59 PM EDT.