Creating Black Hole Jets With a NASA Supercomputer
New simulations carried out on the NASA Center for Climate Simulation’s Discover supercomputer show how weaker, low-luminosity jets produced by a galaxy's monster black hole interact with their galactic environment. Because these jets are more difficult to detect, the simulations help astronomers link these interactions to features they can observe, such as various gas motions and optical and X-ray emissions.
Credit: NASA's Goddard Space Flight Center
Music credit: "Lost Time;" "Ascension;" "Flowing Cityscape;" "Jupiter's Eye;" "Pizzicato Piece;" "Facts;" "Final Words" all from Universal Production Music
Video Descriptive Text available.
Watch this video on the NASA Goddard YouTube channel.
Complete transcript available.
NASA Goddard astrophysicists Ryan Tanner and Kim Weaver have used the NASA Center for Climate Simulation's Discover supercomputer to simulate weak jets produced by monster black holes, which can weigh up to billions of times the Sun's mass. As matter falls toward the black hole, some of it accelerates to near light speed and diverts into a narrow pair of jets flowing in opposite directions. In the grandest examples, these jets extend hundreds of thousands of light-years and are easily detected features in radio.
But weaker jets, which are more difficult to detect, can greatly impact the central regions of their host galaxies. Astronomers suspected weak jets might be responsible for unusual gas motions or otherwise unexplainable optical and X-ray emission in some black-hole-powered galaxies.
So Tanner and Weaver simulated weak jets under realistic conditions for a galaxy about the mass of our own Milky Way. To represent the gas distribution and properties related to the black hole's activity, they referenced spiral galaxies such as NGC 1386, NGC 3079, and NGC 4945.
Tanner modified existing astrophysical hydrodynamics code to explore how the jets and the gas impact each other across 26,000 light-years of space, or about a quarter the diameter of the Milky Way, and 600,000 years of time. From the full set of 100 simulations, the team selected 19 – which consumed 800,000 core hours on Discover – for publication.
The final form of these outflows depends mainly on their interactions with large, dense gas clouds in the galaxy's central region. These clouds can disrupt, deflect, split, or even suppress the jet. This atlas of simulations provides an important touchstone for better understanding how weaker, less apparent jets modify their galaxies.

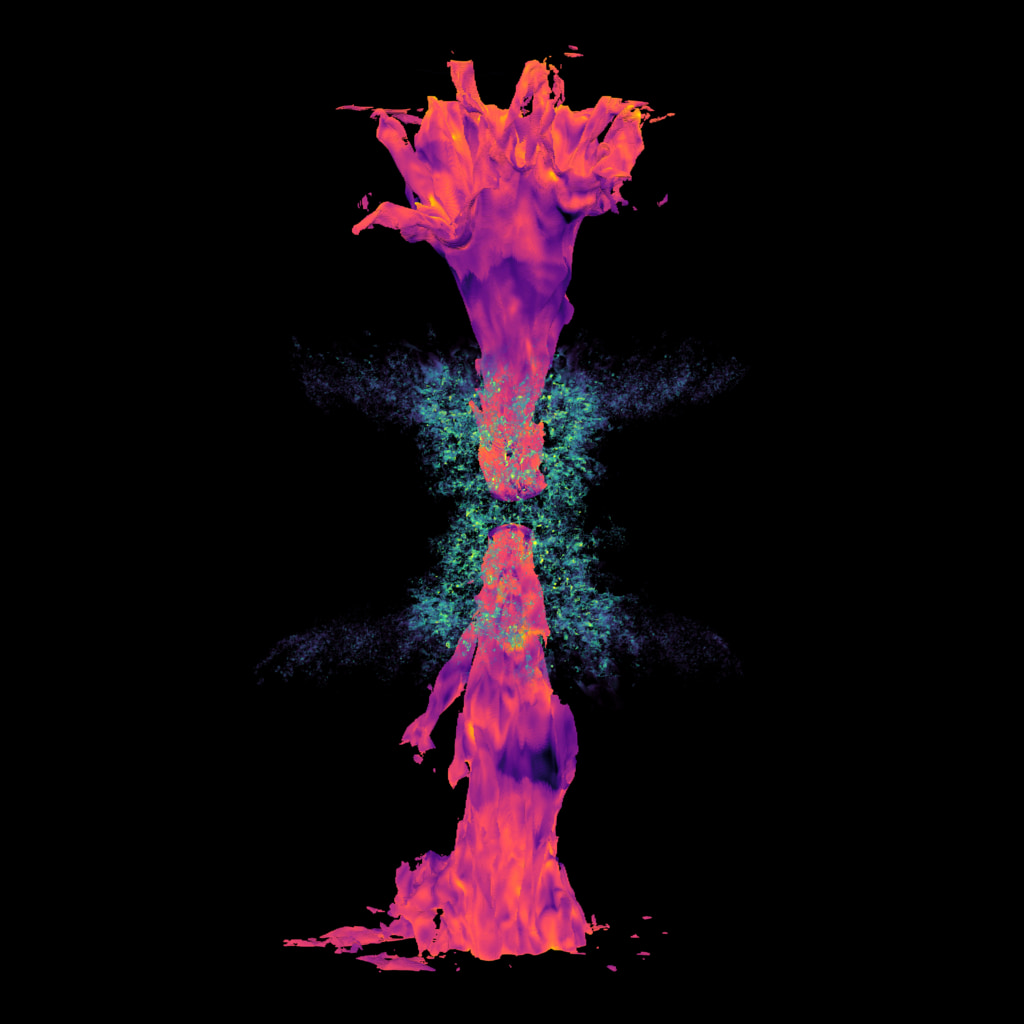
Simulated black hole jets spin and sweep past in this animation. The jets, which contain particles moving near the speed of light, appear in orange, pink, and purple, while the galaxy's environment – stars and gas clouds – show as green and yellow. As weak jets move through this environment, they can be deflected, split apart, or even suppressed. Because astronomers have a hard time observing weak jets directly, these simulations connect them to more easily detected galactic features.
Credit: NASA's Goddard Space Flight Center/R. Tanner and K. Weaver
Descriptive text:
Brightly colored shapes resembling ragged ice cream cones attached by the small end emerge from a black background, spinning and moving toward the viewer in a loop. The orange, pink, and purple cones rise out of mottled green and yellow cylinders.
 formed by a supermassive black hole as they interact with stars and gas clouds (green, yellow) at the center of a galaxy. The jet is angled about 15 degrees toward the plane of its galaxy and is shown in 12 time steps, with each interval representing 50,000 years. The image at bottom right shows the jets 600,000 years after they formed. Credit: NASA's Goddard Space Flight Center/R. Tanner and K. WeaverDescriptive text:Simulations of a black hole jet at 12 different ages appear in two rows on a black background. From left to right in both rows, the jets grow in length and change color, shifting from orange and yellow to pink and purple. The jets emerge from a roughly cylindrical region of mottled green and yellow.")
This image shows the simulated evolution of weak jets (orange, pink, and purple) formed by a supermassive black hole as they interact with stars and gas clouds (green, yellow) at the center of a galaxy. The jet is angled about 15 degrees toward the plane of its galaxy and is shown in 12 time steps, with each interval representing 50,000 years. The image at bottom right shows the jets 600,000 years after they formed.
Credit: NASA's Goddard Space Flight Center/R. Tanner and K. Weaver
Descriptive text:
Simulations of a black hole jet at 12 different ages appear in two rows on a black background. From left to right in both rows, the jets grow in length and change color, shifting from orange and yellow to pink and purple. The jets emerge from a roughly cylindrical region of mottled green and yellow.
The simulations were performed on the 127,232-core Discover supercomputer, the primary computing platform of NASA's Center for Climate Simulation at Goddard Space Flight Center in Greenbelt, Maryland.
Credit: NASA's Goddard Space Flight Center/Conceptual Image Lab
Descriptive text:
In a darkened room stand 12 vertical panels that glow red at the far end, violet in the middle, and green in the foreground. Eight of the panels contain one letter each, spelling Discover. The panels contain partial images that combine to form illustrations of Earth and other objects.

YouTube thumbnail
For More Information
Credits
Please give credit for this item to:
NASA's Goddard Space Flight Center. However, individual items should be credited as indicated above.
-
Producers
- Scott Wiessinger (KBR Wyle Services, LLC)
- Amogh Thakkar
-
Science writer
- Francis Reddy (University of Maryland College Park)
-
Interviewees
- Kim Weaver (NASA/GSFC)
- Ryan Tanner (The Catholic University of America)
-
Scientists
- Ryan Tanner (The Catholic University of America)
- Kim Weaver (NASA/GSFC)
-
Videographers
- Amogh Thakkar
- Sophia Roberts (Advocates in Manpower Management, Inc.)
-
Video editor
-
Editor
- Scott Wiessinger (KBR Wyle Services, LLC)
-
Visualizer
- Ryan Tanner (The Catholic University of America)
Series
This page can be found in the following series:Related papers
Related
- ID: 14498Produced Video
Sources
- ID: 14203
 Produced Video
Release date
This page was originally published on Tuesday, November 15, 2022.
This page was last updated on Wednesday, May 3, 2023 at 11:43 AM EDT.