NASA’s Compton Mission Glimpses Supersized Neutron Stars
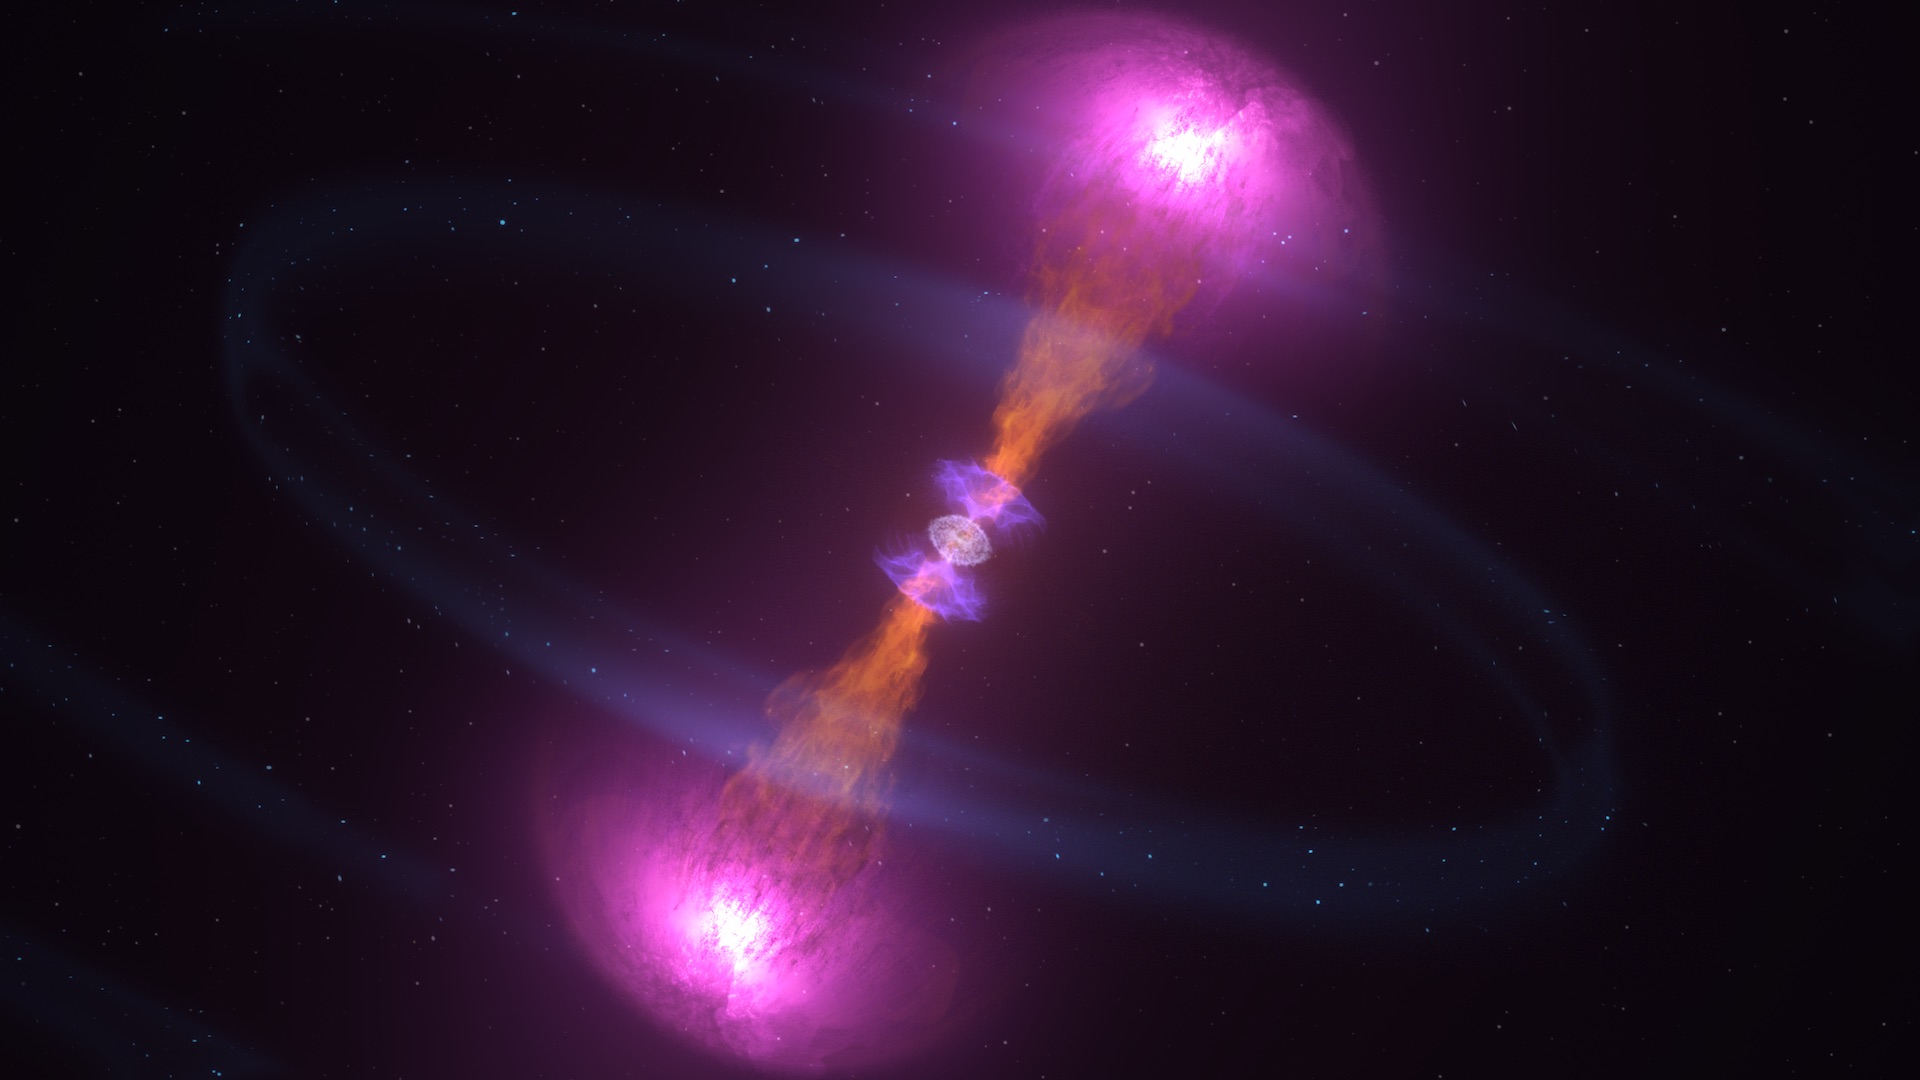
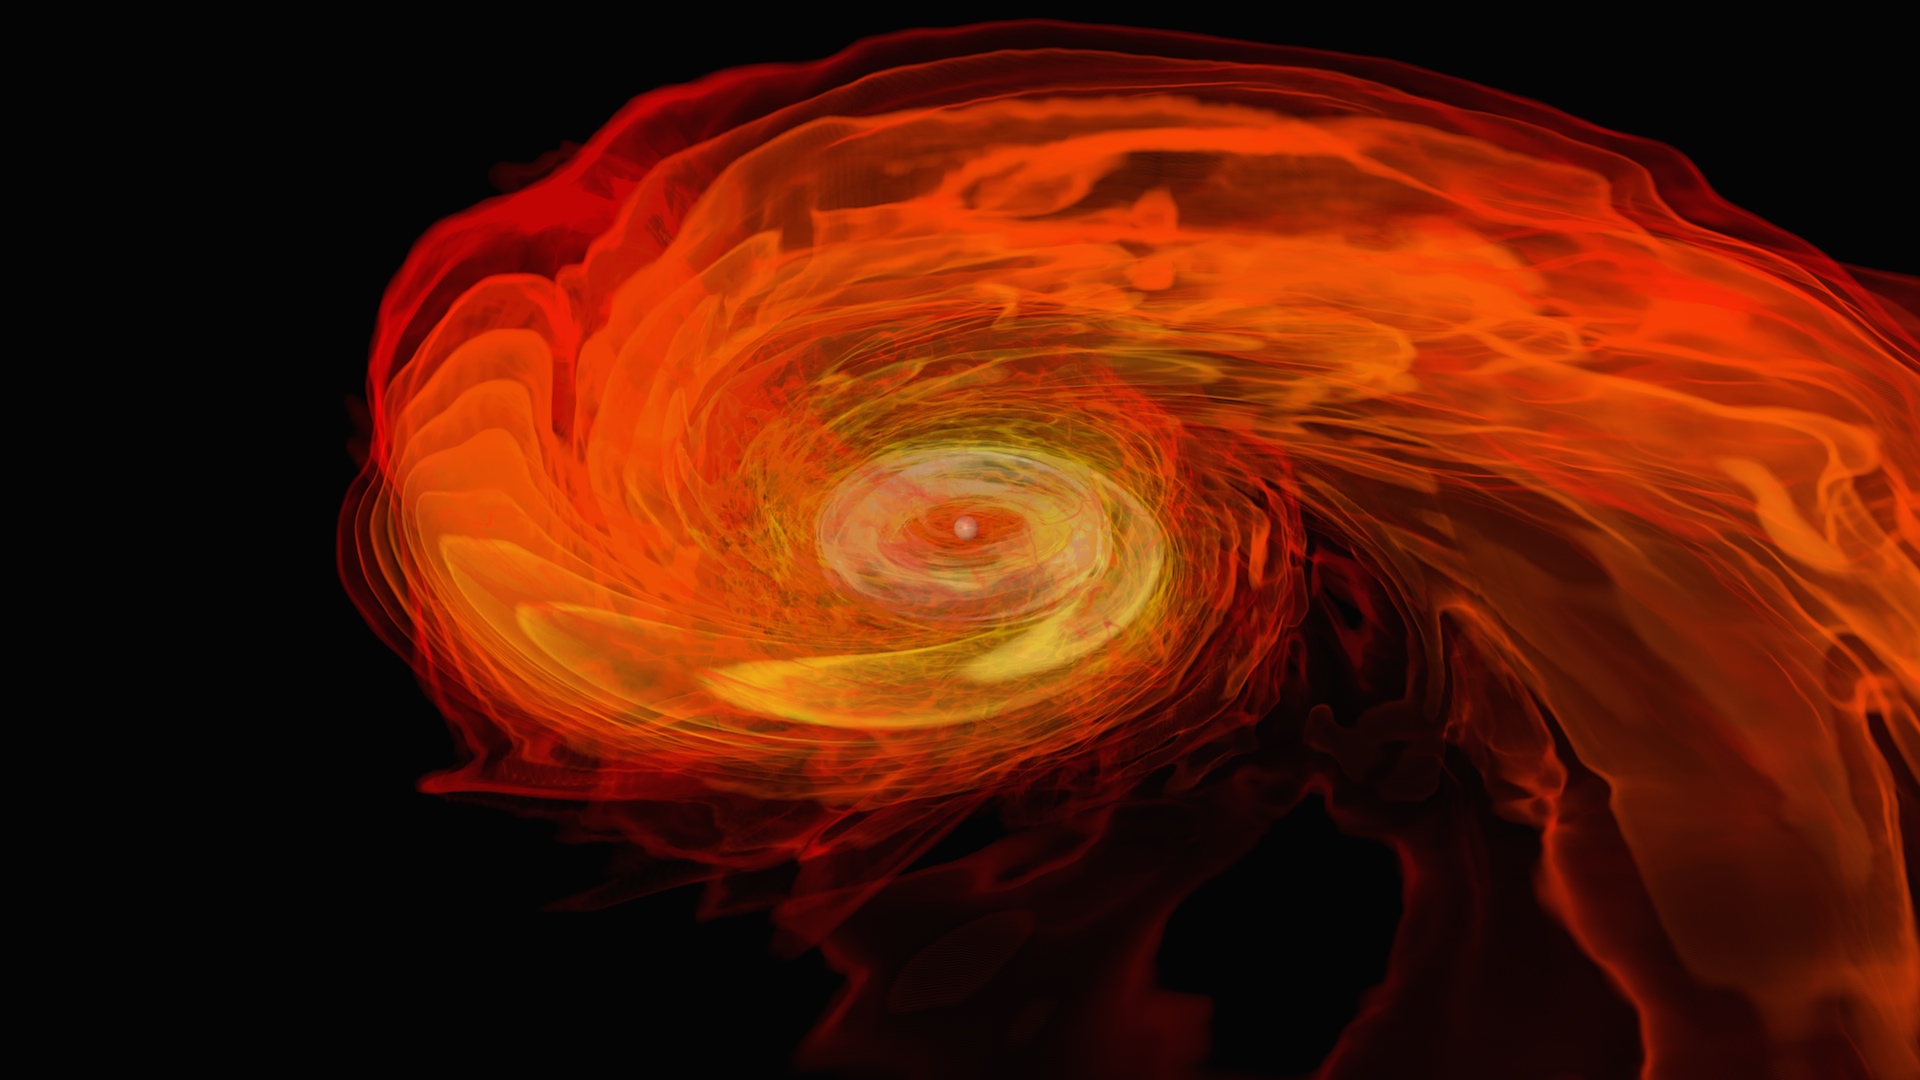
This simulation tracks the gravitational wave and density changes as two orbiting neutron stars crash together. Dark purple colors represent the lowest densities, while yellow-white shows the highest. An audible tone and a visual frequency scale (at left) track the steady rise in the frequency of gravitational waves as the neutron stars close. When the objects merge at 42 seconds, the gravitational waves suddenly jump to frequencies of thousands of hertz and bounce between two primary tones (quasiperiodic oscillations, or QPOs). The presence of these signals in such simulations led to the search and discovery of similar phenomena in the light emitted by short gamma-ray bursts.
Credit: NASA's Goddard Space Flight Center and STAG Research Centre/Peter Hammond
Complete transcript available.
Watch this video on the NASA Goddard YouTube channel.
Visual description:
On a black background with a faint gray grid, two multicolored blobs representing merging neutron stars circle and close. The colors indicate density. Yellow-white indicates the highest densities, at the centers of the objects. The colors change to orange and red at their periphery, with purple colors representing matter torn from and swirling with the neutron stars as they orbit. The grid shrinks as the camera pulls back to capture a wider view of the merger. A pale orange display at left shows the changing frequency of the gravitational waves generated, which is also indicated by the rising tone. As the merger occurs, the screen shows a spinning yellow blob at center immersed in a large cloud of magneta and purple debris.
Astronomers studying archival observations of powerful explosions called short gamma-ray bursts (GRBs) have detected light patterns indicating the brief existence of a superheavy neutron star shortly before it collapsed into a black hole. This fleeting, massive object likely formed from the collision of two neutron stars.
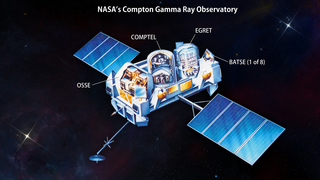
Astronomers looked for these signals in 700 short GRBs detected with NASA’s Neil Gehrels Swift Observatory, Fermi Gamma-ray Space Telescope, and the Compton Gamma Ray Observatory. They found these flickering gamma-ray patterns – called quasiperiodic oscillations – in two bursts observed by Compton’s Burst And Transient Source Experiment (BATSE) on July 11, 1991, and Nov. 1, 1993. The larger area of the BATSE instrument gave it the upper hand in finding these faint patterns.
A neutron star forms when the core of a massive star runs out of fuel and collapses. This produces a shock wave that blows away the rest of the star in a supernova explosion. Neutron stars typically pack more mass than our Sun into a ball about the size of a city, but above a certain mass, they must collapse into black holes.
Merging neutron stars power short GRBs, blasts of high-energy light that last less than two seconds. Computer simulations of gravitational waves emitted by these mergers show a sudden jump in frequency – exceeding 1,000 hertz – as the objects coalesce. These signals are too fast and faint for existing gravitational wave observatories to detect. But astronomers reasoned that similar signals could appear in the gamma-ray emission from short GRBs.
Both the Compton data and computer simulations revealed mega neutron stars tipping the scales by 20% more than the most massive precisely measured neutron star known, dubbed J0740+6620, which weighs in at nearly 2.1 times the Sun’s mass. Superheavy neutron stars also have nearly twice the size of a typical neutron star, or about twice the length of Manhattan Island.
The mega neutron stars spin nearly about 78,000 times a minute – almost twice the speed of J17482446ad, the fastest pulsar on record. This rapid rotation briefly supports the objects against further collapse, allowing them to exist just a few tenths of a second, after which they proceed to form a black hole far faster than the blink of an eye.
Full version of the simulation above.
Credit: NASA's Goddard Space Flight Center and STAG Research Centre/Peter Hammond
Complete transcript available.
Full version of the simulation above, but without labels or other annotations.
Credit: NASA's Goddard Space Flight Center and STAG Research Centre/Peter Hammond
Complete transcript available.
This is a shortened and more annotated version of the simulation that links the gravitational wave changes to gamma-ray observations.
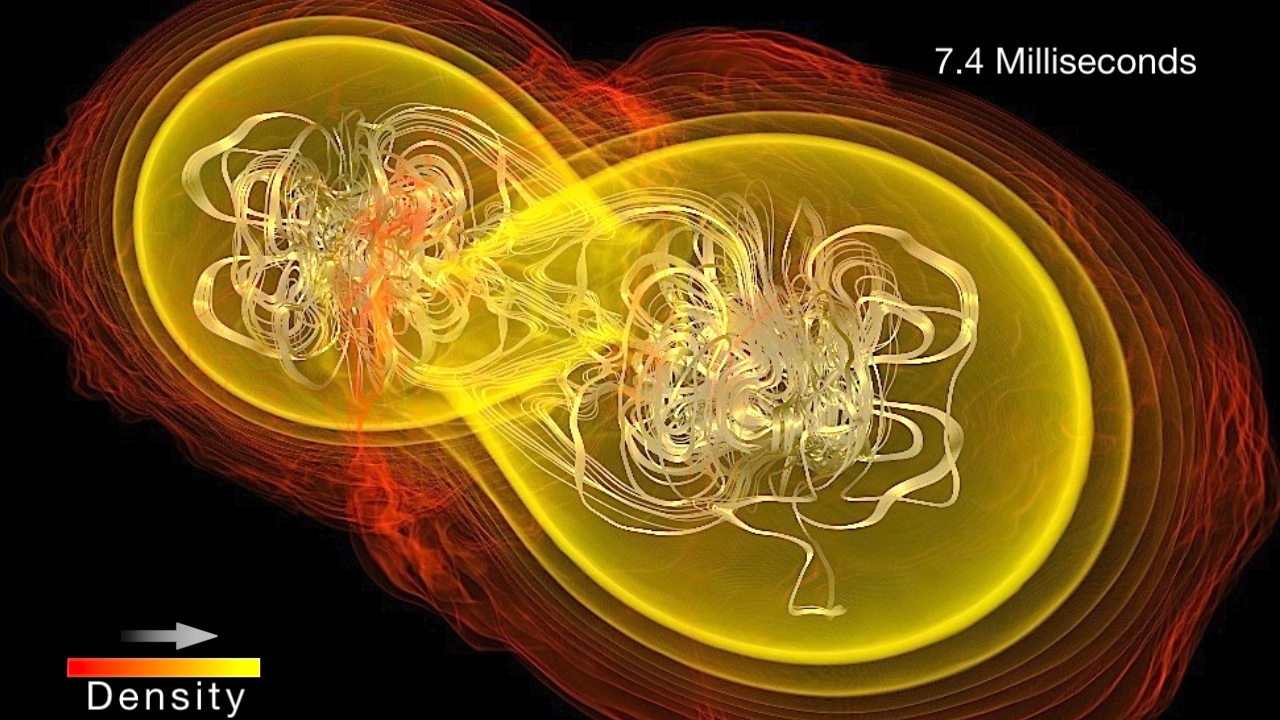
This animation follows the gravitational wave and density changes in a simulated neutron star merger and compares them to measurements of a short gamma-ray burst observed by NASA's Compton mission on July 11, 1991. Dark purple colors represent the lowest-density material, while yellow-white shows the highest. An audible tone and a visual frequency scale (at left) track the steady rise in the frequency of gravitational waves as the neutron stars close. When the objects merge at 19 seconds, the gravitational waves suddenly jump to frequencies of thousands of hertz and bounce between two primary tones. A magenta line appears at left to illustrate how quasiperiodic oscillations (QPOs) found in the gamma-ray emission correlate to those of the simulated gravitational waves. At the same time, a graph at upper right traces the changes in gamma-ray brightness observed during the same burst. To symbolize the ultimate formation of a black hole, a dot has been added at the center.
Credit: NASA's Goddard Space Flight Center and STAG Research Centre/Peter Hammond
Complete transcript available.
Watch this video on the NASA.gov Video YouTube channel.
An 8K version of the full simulation, with frames available.
Credit: STAG Research Centre/Peter Hammond
A 2K version of the simulation that includes additional information on the physical and density scales; frames are available.
Credit: STAG Research Centre/Peter Hammond
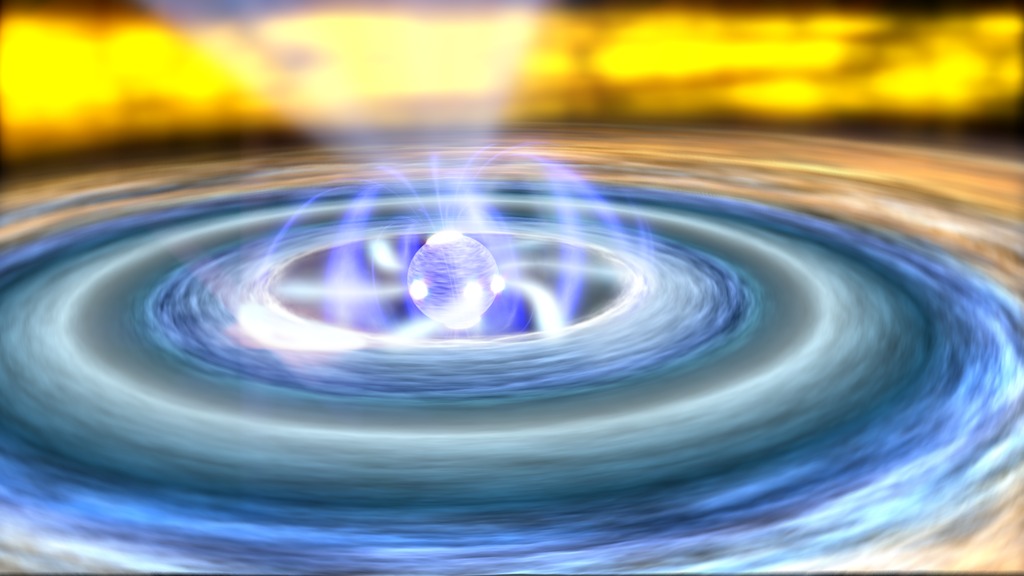
 spins in the center of a colorful disk of gas, some of which follows the magnetic field (blue lines) and flows (blue-white arcs) onto the object’s surface. One interpretation of the quasiperiodic oscillations seen in X-rays in these systems is the formation of a hot spot (white oval) near the disk's inner edge, which expands and contracts as its properties change. Because of this irregular orbit, the hotspot emission varies within a range of frequencies.Credit: NASA's Goddard Space Flight Center Conceptual Image LabVisual description:At the center of a muticolor disk spins a blue sphere, a neutron star, surrounded by darker blue arcs representing its magnetic field. Cones of pale blue-white X-ray emission issue from the object's magnetic poles, wobbling regularly because they are not aligned with the its spin axis. Two pale arcs represent streams of gas flowing from the inner, bluish edge of the disk to the neutron star. The disk's inner edge shrinks and expands, carrying with it a bright white oval – an orbiting hot spot.")
In this animation, a neutron star (blue sphere) spins in the center of a colorful disk of gas, some of which follows the magnetic field (blue lines) and flows (blue-white arcs) onto the object’s surface. One interpretation of the quasiperiodic oscillations seen in X-rays in these systems is the formation of a hot spot (white oval) near the disk's inner edge, which expands and contracts as its properties change. Because of this irregular orbit, the hotspot emission varies within a range of frequencies.
Credit: NASA's Goddard Space Flight Center Conceptual Image Lab
Visual description:
At the center of a muticolor disk spins a blue sphere, a neutron star, surrounded by darker blue arcs representing its magnetic field. Cones of pale blue-white X-ray emission issue from the object's magnetic poles, wobbling regularly because they are not aligned with the its spin axis. Two pale arcs represent streams of gas flowing from the inner, bluish edge of the disk to the neutron star. The disk's inner edge shrinks and expands, carrying with it a bright white oval – an orbiting hot spot.
On July 11, 1991, the Burst And Transient Source Experiment (BATSE) aboard NASA's Compton Gamma Ray Observatory detected the short gamma-ray burst whose light curve – a plot of brightness over time – is shown above. Between about 93 and 103 milliseconds, a new analysis detected quasiperiodic oscillations associated with the formation of a single, short-lived, superheavy neutron star, formed by the merger of two smaller ones.
Credit: Cecilia Chirenti, University of Maryland, College Park
Visual description:
A ragged magenta line representing the changing brightness of the short runs across a rectangular plot. Time ranging from 90 to 120 milliseconds is shown on the bottom axis, while the number of detected gamma-ray photons, called counts, ranges from 0 to 30 along the left axis. The brightness comes to an abrupt peak (more than 25 counts) shortly after 100 milliseconds. A label at upper right reads "GRB 910711."

The Compton Gamma Ray Observatory imaged during its deployment from space shuttle Atlantis in April 1991.
Credit: NASA/STS-37 crew
Visual description:
Hanging in orbit above a tan and blue arc of Earth, a white, rectangular spacecraft floats outside a window on space shuttle Atlantis. The spacecraft has two silvery domes at the near end a silver cylindrical element at its far end. Two dark solar panels extend left and right.
Credits
Please give credit for this item to:
NASA's Goddard Space Flight Center. However, individual items should be credited as indicated above.
-
Producer
- Scott Wiessinger (KBR Wyle Services, LLC)
-
Science writer
- Francis Reddy (University of Maryland College Park)
-
Scientist
- Cecilia Chirenti (University of Maryland, College Park)
-
Visualizer
- Peter Hammond (University of Southampton)
Missions
This page is related to the following missions:Series
This page can be found in the following series:Related
- ID: 14434
 Produced Video
 - ID: 12740
- ID: 12194
 Produced Video
 - ID: 11804
 Produced Video
 - ID: 11530
 Produced Video
 - ID: 10740
 Produced Video
Release date
This page was originally published on Monday, January 9, 2023.
This page was last updated on Sunday, January 12, 2025 at 11:16 PM EST.