Two Scientists Have a Frank and Honest Discussion about Antarctica
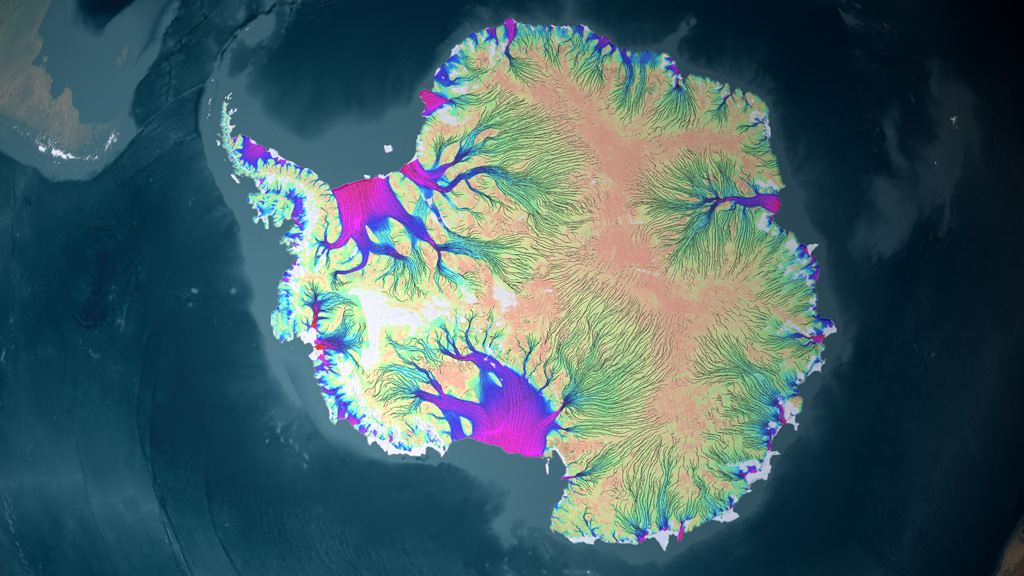
NASA Glaciologists Kelly Brunt and Alex Gardner discuss the history, challenges and evolution of mapping the Antarctic continent and what it means for science and society.
Music: "Man vs. Clock," "Curious," "Transitions," "Phosphorus," "Hypervelocity," "Double Agent," "Bloom," "Mirroring Thought," Universal Production Music.
This video can be freely shared and downloaded. While the video in its entirety can be shared without permission, some individual imagery provided by pond5.com, Brooke Medley, Helen Millman, Michael Wethington, Robert Bindschadler, Kelly Brunt, The National Science Foundation, and The National Reconnaissance Office, and is obtained through permission and may not be excised or remixed in other products. Specific details on stock footage may be found here. For more information on NASA’s media guidelines, visit https://www.nasa.gov/multimedia/guidelines/index.html.
Complete transcript available.
Notes on footage:
00:00-00:06; 00:32-00:38: Provided by Michael Wethington
00:07-00:13; 09:07-09:15: Provided by pond5.com
02:06-02:14: Provided by Robert Bindschadler
02:16-02:18; 06:26-06:30: Provided by Brooke Medley
05:02-05:07: Provided by Helen Millman
06:30-06:46; 07:04-07:08: Provided by the National Science Foundation
07:11-08:15: Provided by the National Reconnaissance Office
08:29-08:53: Provided by Kelly Brunt
Credits
Please give credit for this item to:
NASA's Goddard Space Flight Center
-
Producer
- Ryan Fitzgibbons (KBR Wyle Services, LLC)
-
Scientists
- Alex S. Gardner (NASA/JPL CalTech)
- Kelly Brunt (Earth System Science Interdisciplinary Center/University of Maryland)
-
Interviewees
- Kelly Brunt (Earth System Science Interdisciplinary Center/University of Maryland)
- Alex S. Gardner (NASA/JPL CalTech)
-
Animator
- Adriana Manrique Gutierrez (KBR Wyle Services, LLC)
-
Visualizer
-
Kel Elkins
(USRA)

-
Kel Elkins
(USRA)
-
Writer
- Ryan Fitzgibbons (KBR Wyle Services, LLC)
-
Editor
- Ryan Fitzgibbons (KBR Wyle Services, LLC)
-
Narrator
- LK Ward (KBR Wyle Services, LLC)
-
Technical support
- LK Ward (KBR Wyle Services, LLC)
-
Videographers
- Jefferson Beck (KBR Wyle Services, LLC)
- Brooke Medley (NASA/GSFC)
Missions
This page is related to the following missions:Series
This page can be found in the following series:Related
- ID: 13441
 Produced Video
 - ID: 13444
 Produced Video
 - ID: 13206
 Produced Video
 - ID: 12905
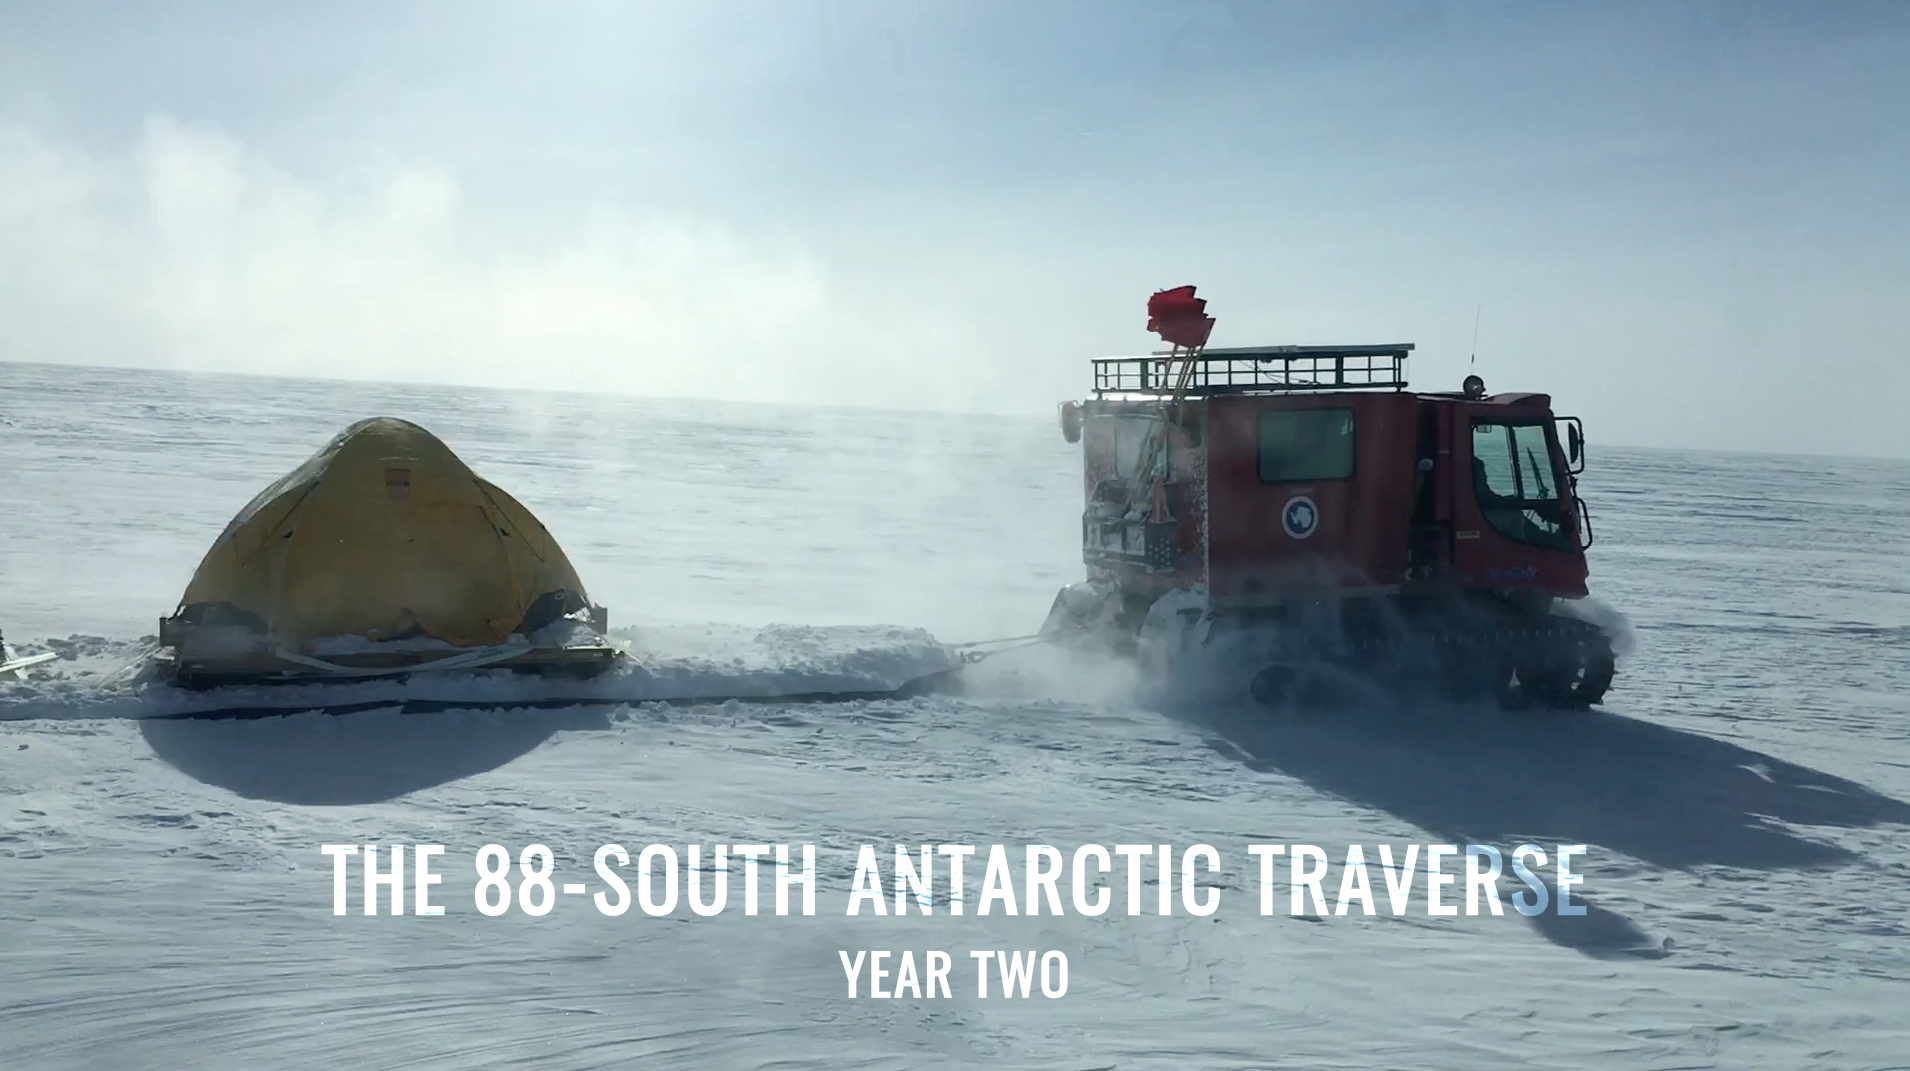
![NASA cryospheric scientist Kelly Brunt and ICESat-2 Deputy Project Scientist Tom Neumann recall some of the highlights and challenges from the recent 88-South Antarctic Traverse.Music: "Lights," Alexius Tschallener [SUISA], Dominik Johnson [PRS]; "Vulnerable Moment," John Ashton Thomas [PRS]Complete transcript available.](/vis/a010000/a012900/a012905/12905_thumbstill_print.jpg) Produced Video
Produced Video
Sources
- ID: 4478
 Visualization
 - ID: 4871
 Visualization
 - ID: 4796
 Visualization
 - ID: 13193
 Produced Video
 - ID: 10923
- ID: 3849
 Visualization
 - ID: 10412
 Produced Video
 - ID: 10416
 Produced Video
 - ID: 10202
 Produced Video
 - ID: 2839
 Visualization
Release date
This page was originally published on Friday, March 18, 2022.
This page was last updated on Wednesday, May 3, 2023 at 11:44 AM EDT.