Rainfall Anomalies for South America from TRMM: January, 1997, through February, 1998 (Version 2)
The term 'rainfall anomalies' means the differences in rainfall from a normal year.
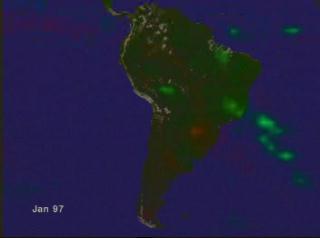
Monthly average precipitation anomalies over South America as measured by TRMM for January 1997 through February 1998

Color bar for precipitation anomalies
Credits
Please give credit for this item to:
NASA/Goddard Space Flight Center
Scientific Visualization Studio
Animator
- Greg Shirah (NASA/GSFC)
Scientist
- Chris Kummerow (NASA/GSFC)
Release date
This page was originally published on Monday, December 7, 1998.
This page was last updated on Wednesday, May 3, 2023 at 1:59 PM EDT.
Missions
This visualization is related to the following missions:Series
This visualization can be found in the following series:Datasets used in this visualization
Monthly Average Precipitation Anomaly [TRMM: PR and TMI]
ID: 517This dataset can be found at: http://disc.sci.gsfc.nasa.gov/data/datapool/TRMM/01_Data_Products/index.html
See all pages that use this dataset
Note: While we identify the data sets used in these visualizations, we do not store any further details, nor the data sets themselves on our site.