AGU 2019 — Postcards from the edge of space: New images, new phenomena, and new insights
In a Dec. 10 press event at the fall meeting of the American Geophysical Union in San Francisco, California, three scientists presented new images of the ionosphere, the dynamic region where Earth’s atmosphere meets space. Home to astronauts and everyday technology like radio and GPS, the ionosphere constantly responds to changes from space above and Earth below.
The collection of images presented include the first images from NASA’s ICON, new science results from NASA’s GOLD, and observations of a fleeting, never-before-studied aurora. Together, they bring color to invisible processes that have widespread implications for the part of space that is closest to home.
SPEAKERS:
• Jennifer Briggs, Pepperdine University, Malibu, California, United States
• Richard Eastes, University of Colorado Boulder, Boulder, Colorado, United States
• Thomas Immel, University of California Berkeley, Berkeley, California, United States
In this animation of the solar wind, particles stream from the Sun towards Earth. Solar radiation ionizes the upper atmosphere, creating a sea of charged particles: the ionosphere.
Credit: NASA
All-sky cameras in Longyearbyen, Norway, near the Arctic Circle captured these images of an unusual, spiraling aurora.
Credit: Fred Sigernes/Kjell Henriksen observatory, Longyearbyen, Norway
This animation illustrates the disturbance in the magnetosphere — the region of space dominated by Earth’s magnetic field — that prompted the twisting aurora. The solid line represents the bow shock, a shock wave created by the supersonic speed of the solar wind. The dashed line represents the magnetopause, the boundary where Earth’s magnetic field meets the surrounding plasma and solar wind.
Credit: Jennifer Briggs

GOLD surveys the ionosphere from 22,000 miles above Earth, in ultraviolet light. This particular wavelength of light is invisible to our eyes, but useful for tracking changes in the ionosphere’s temperature, density and composition.
Credit: GOLD/Stanley Solomon
This sequence of images shows how the composition of the neutral atmosphere changes during a geomagnetic storm. Specifically, the ratio of atomic oxygen to molecular nitrogen density is shown. During these storms, the neutral atmosphere near the magnetic poles is heated by energy coming from the magnetosphere. Near the poles, the density ratio decreases rapidly and dramatically. At lower latitudes, the opposite happens, as large amounts of atomic oxygen move from high to low latitudes. Since the neutral atmosphere and ionosphere are coupled, composition changes alter the ionosphere density, as well as the behavior of radio communications signals.
Credit: GOLD/John Correira
This data visualization shows the July 2, 2019 total solar eclipse over South American in visible light (left) and ultraviolet light (right). The ultraviolet light shows emissions from molecular nitrogen. This is the first time scientists have been able to watch such eclipse-borne changes evolve across the Southern hemisphere from space.
Credit: NASA’s Scientific Visualization Studio/GOLD/Thomas Bridgman/Saurav Aryal

The nighttime ionosphere varies a great deal from night to night. These panels show the density and shifting location of the nighttime ionosphere between Oct. 7-25, 2019. Most of the ions are oxygen ions. At night, when they recombine with electrons, they emit light at a specific wavelength—135.6 nanometers—which GOLD observes. Regions of higher ion density produce brighter emissions. Radio disturbances often occur when longitudinal gaps develop, such as the one off the east coast of South America in the upper right image. Why the nighttime ionosphere varies so much—even during quiet geomagnetic conditions—is not understood.
Credit: GOLD/Robert Daniell
This visualization shows the fields of view for the ICON and GOLD missions, represented by the colored triangles that scan over Earth. During certain parts of its orbit, ICON passes through GOLD's field of view and each mission can get a snapshot of the same region, from their own unique perspectives.
Credit: NASA's Scientific Visualization Studio/Thomas Bridgman
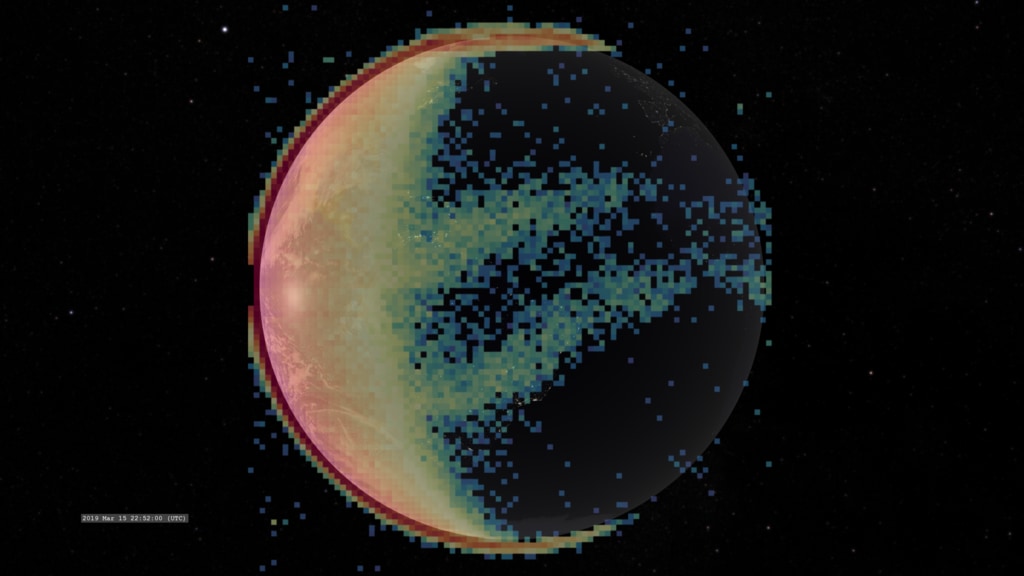
The Extreme Ultraviolet Instrument depends upon accurately measuring the light from glowing oxygen in order to track the height and density of the daytime ionosphere. Since the team had never made these measurements in orbit before, they calibrated their instrument on a known source: the Moon. The bright line on the left are EUV emissions from ionized helium in the solar wind, which fills the solar system. The horizontal stripes are the result of EUV scanning over the Moon, which reflects solar radiation.
Credit: ICON/Martin Sirk

Earth, as seen by ICON’s EUV instrument.
Credit: ICON/Martin Sirk
The Far Ultraviolet Instrument takes images in the same wavelength as GOLD. At night, it measures the density of the ionosphere, and during the day, composition. The pink images are nitrogen emissions, and the green are oxygen.
Credit: ICON/Harald Frey/Thomas Bridgman
Airglow refers to the natural glow of Earth’s atmosphere caused by solar radiation. These images were taken from the International Space Station.
Credit: NASA

MIGHTI tracks red and green oxygen airglow. On the left, MIGHTI images of the red and green airglow are superimposed. On the right, a view from the ISS shows how this airglow appears to the eye.
Credit: ICON/Christoph Englert/Joy Ng
MIGHTI separates the red and green oxygen airglow to allow scientists to accurately measure how the neutral atmosphere moves, which scientists think plays a role in the ionosphere’s daily changes.
Credit: ICON/Christoph Englert/Joy Ng
Credits
Please give credit for this item to:
NASA's Goddard Space Flight Center
-
Scientists
- Tom Immel (SSL Berkeley)
- Richard Eastes (University of Colorado Boulder)
-
Writer
- Kathalina Tran (SGT)
-
Producer
- Joy Ng (USRA)
-
Support
- Sarah Frazier (ADNET Systems, Inc.)
Related
- ID: 4762

- ID: 13503
![Music credit: "Inner Strength" by Brava [SGAE], Dsilence [SGAE], Input [SGAE], Output [SGAE]Complete transcript available.](/vis/a010000/a013500/a013503/Geospace_YouTube.00001_print.jpg) Produced Video
Produced Video - ID: 4737
 Visualization
Release date
This page was originally published on Tuesday, December 10, 2019.
This page was last updated on Wednesday, May 3, 2023 at 1:45 PM EDT.