Precipitation Accumulation and Anomalies
2015-2016 Precipitation Accumulation
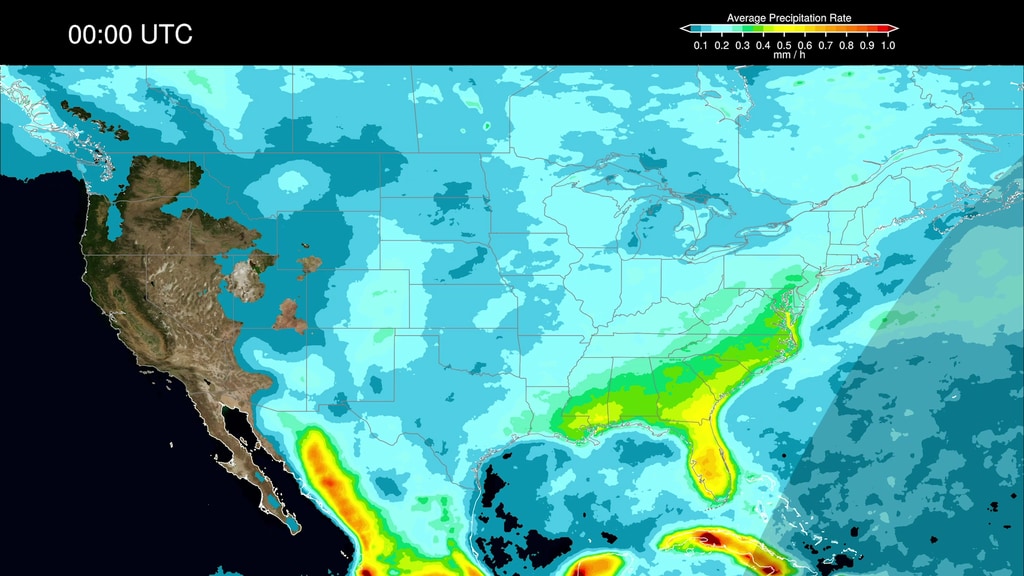
This visualization of the precipitation from IMERG, averaged over 90 days, shows how the broad patterns of global precipitation fluctuate during this particular time period. Unlike the climatology, the vigorous, relatively small-scale precipitation systems create a very "lumpy", continually evolving pattern. Most notably here, the 2015-2016 El Niño is one of the strongest on record. The changes in the atmospheric circulation shift the rainfall that typically falls in the western Pacific—over Southeast Asia and northern Australia—to the central or eastern Pacific.
The anomalies show the deviation from the normal seasonal cycle of precipitation. These maps help interpret the accumulation maps by isolating attention on the changes. Most notably here, the 2015-2016 El Niño is one of the strongest on record. The changes in the atmospheric circulation shift the rainfall that typically falls in the western Pacific—over Southeast Asia and northern Australia—to the central or eastern Pacific. As well, there are dry conditions across the Caribbean, tropical Atlantic, and northern South America. This display reduces the welter of "ordinary" precipitation and focuses attention on the systematic changes that are persistent, but not necessarily large enough to be readily noticed in the accumulations.
2015-2016 Precipitation Anomalies featuring El Nino.
Credits
Please give credit for this item to:
NASA's Goddard Space Flight Center
-
Producers
- Ryan Fitzgibbons (USRA)
- Joy Ng (USRA)
-
Scientists
-
George Huffman
(NASA/GSFC)

- Dalia B Kirschbaum (NASA/GSFC)
-
George Huffman
(NASA/GSFC)
-
Visualizers
- Jackson Boon Sze Tan (USRA)
-
Alex Kekesi
(Global Science and Technology, Inc.)
Related
- ID: 13348
![Complete transcript available.Music Credits: "Battle For Our Future" and "Wonderful Orbit" by Tom Furse Fairfax Cowan [PRS], "Transitions" by Ben Niblett [PRS] and Jon Cotton [PRS], "Emerging Discovery by "Rik Carter [PRS] from Killer Tracks](/vis/a010000/a013300/a013348/13348_DailyCycleOfRain_YouTube.00561_print.jpg) Produced Video
Produced Video - ID: 13346
 Produced Video
Used as a Source In
- ID: 13909
 Produced Video
 - ID: 13345
 Produced Video
Release date
This page was originally published on Wednesday, October 16, 2019.
This page was last updated on Sunday, February 2, 2025 at 12:22 AM EST.