NASA's TSIS-1: Tracking Sun’s Power to Earth (Prelaunch Media Roll-Ins)
We live on a solar-powered planet. As we wake up in morning, the Sun peeks out over the horizon to shed light on us, blankets us with warmth, and provides cues to start our day. At the same time, the Sun’s energy drives our planet’s ocean currents, seasons, weather, and climate. Without the Sun, life on Earth would not exist.
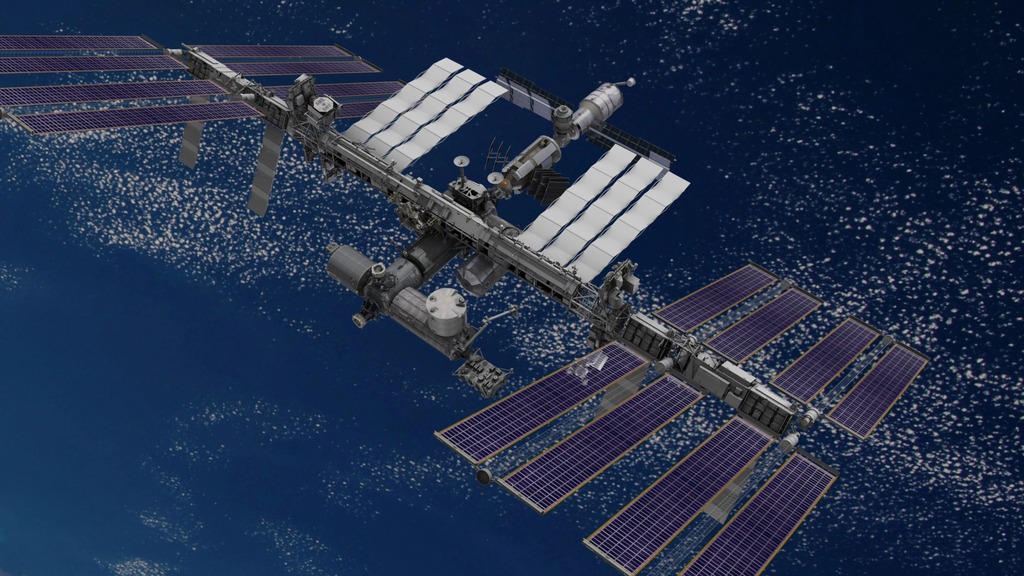
Total and Spectral solar Irradiance Sensor (TSIS-1) is a NASA mission that will orbit on the International Space Station in order to study the Sun's energy input to Earth and how solar variability affects climate. TSIS-1 follows the Sun, from the ISS sunrise to its sunset, which happens every 90 minutes. At sunset, it rewinds, recalibrates and waits for the next sunset.
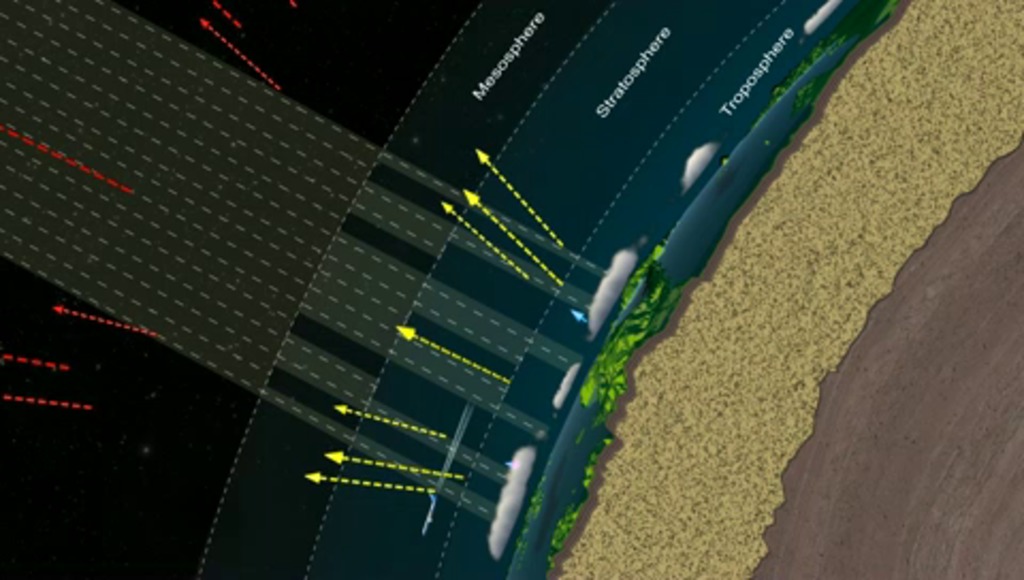
Total solar irradiance, also known as TSI, is the total energy from the Sun – in the form of both visible and invisible sunlight – that reaches Earth’s atmosphere. Though TSI was historically called the 'solar constant,’ we now know that TSI varies in both the short- and long-term: from small changes happening over minutes, to dramatic shifts over the Sun’s billion-year evolution. Solar irradiance is one of the most fundamental of all space-based climate data records and for that reason scientists have measured TSI from space since 1978 to help quantify the role of changes on the Sun in climate change.
Spectral irradiance is the full spectrum of sunlight reaching the top of Earth’s atmosphere classified by different colors of light, like the colors we can see in a rainbow (visible light, reaching the ground), and the light we cannot sense with our eyes, such as the ultraviolet (shorter wavelengths than visible, half of UV rays are blocked by the stratospheric ozone layer and oxygen atoms), and infrared wavelengths (longer than the visible,) that reflect off clouds and water vapor. A little less than half of the energy Earth receives in the form of light is in the visible part of the spectrum.
NASA and NOAA scientists work together to study the ozone layer, monitoring the hole over Antarctica as it fluctuates with the seasons. Scientists use computer models to simulate and help understand Earth’s physical, chemical, and weather processes, including the complex interactions between UV light, temperature and upper atmospheric chemical constituents such as ozone. Atmospheric models need accurate UV measurements over a wide range of wavelengths to correctly simulate the effects of changing UV on the atmosphere. Understanding these natural variations is vital when studying the effects of human influence on Earth’s atmosphere, including ozone loss from human-made ozone depleting chemicals and climate change from greenhouse gases.
The picture on the left shows a calm sun from Oct. 2010. The right side, from Oct. 2012, shows a much more active and varied solar atmosphere as the sun moves closer to peak solar activity, or solar maximum, predicted for 2013. Both images were captured by NASA's Solar Dynamics Observatory (SDO) observing light emitted from the 1 million degree plasma, which is a good temperature for observing the quiet corona.
Solar irradiance is affected by both sunspots, which are cooler and darker areas of the Sun, and faculae, the associated bright areas that appear near sunspots. The faculae increase the Sun’s irradiance more than the sunspots lessen it, so the Sun is brighter when there are more sunspots, which is most common near the peak of the 11-year sunspot cycle.
NASA's Solar Radiation and Climate Experiment, or SORCE, collected this data on total solar irradiance, the total amount of the Sun’s radiant energy, throughout Sept. 2017. While the Sun produced high levels of extreme ultraviolet light, SORCE actually detected a dip in total irradiance during the month’s intense solar activity. A possible explanation for this observation is that over the active regions — where solar flares originate — the darkening effect of sunspots is greater than the brightening effect of the flare’s extreme ultraviolet emissions. As a result, the total solar irradiance suddenly dropped during the flare events. Scientists gather long-term solar irradiance data in order to understand not only our dynamic star, but also its relationship to Earth's environment and climate. NASA is ready to launch the Total Spectral solar Irradiance Sensor-1, or TSIS-1, this December to continue making total solar irradiance measurements.
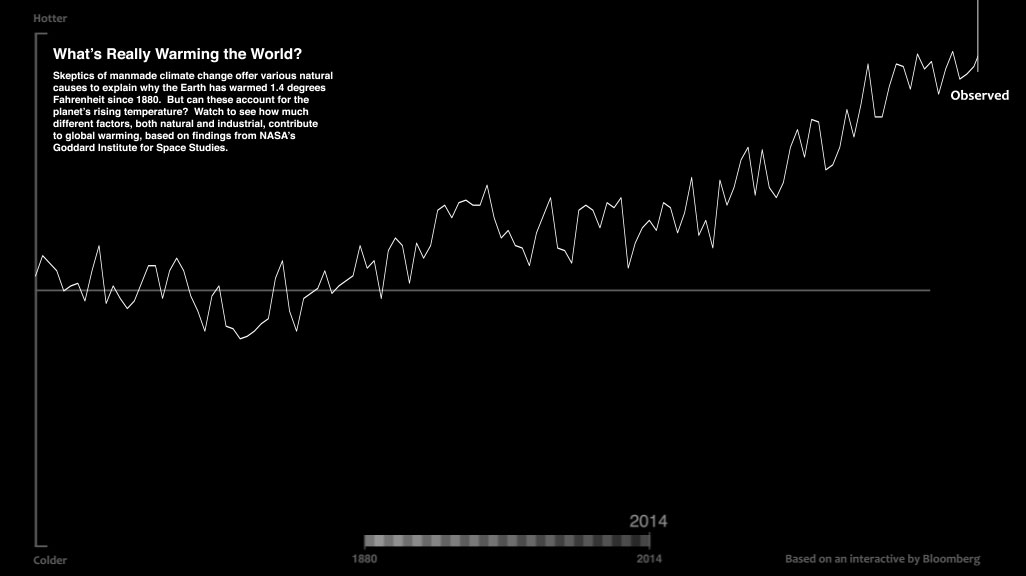
Scientists have studied the links between solar activity and climate and say the small variations in the Sun's irradiance over the last century – estimated to be about the same magnitude of a typical solar cycle variation – cannot explain the intensity and speed of warming trends seen on Earth over this time.
Credits
Please give credit for this item to:
NASA's Goddard Space Flight Center
-
Producers
- Rani Gran (NASA/GSFC)
- Michael Starobin (KBR Wyle Services, LLC)
-
Narrator
- Michael Starobin (KBR Wyle Services, LLC)
-
Writer
- Michael Starobin (KBR Wyle Services, LLC)
-
Editor
- Michael Starobin (KBR Wyle Services, LLC)
-
Animators
- Walt Feimer (KBR Wyle Services, LLC)
- Amy Moran (Global Science and Technology, Inc.)
- Lisa Poje (USRA)
-
Scientists
-
Gavin A. Schmidt
(NASA/GSFC GISS)

- Kate Marvel (NASA/GSFC GISS)
-
Gavin A. Schmidt
(NASA/GSFC GISS)
Related
- ID: 11937
 Produced Video
 - ID: 30615
 Hyperwall Visual
Sources
- ID: 12752
 Produced Video
Release date
This page was originally published on Tuesday, December 5, 2017.
This page was last updated on Sunday, January 5, 2025 at 12:18 AM EST.