SDO: Year 7
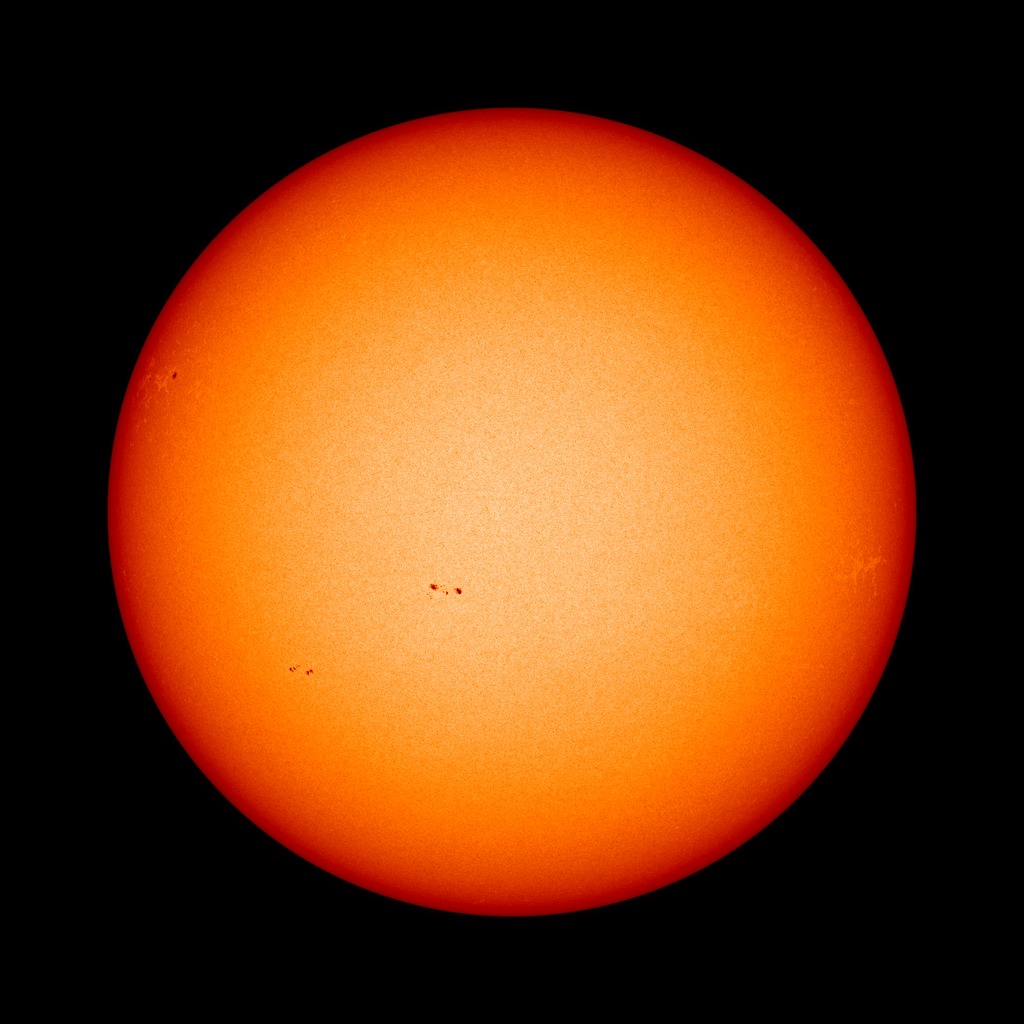
The Solar Dynamics Observatory, or SDO, has now captured nearly seven years worth of ultra-high resolution solar footage. This time lapse shows that full run from two of SDO's instruments. The large orange sun is visible light captured by the Helioseismic and Magnetic Imager, or HMI. The smaller golden sun is extreme ultraviolet light from the Atmospheric Imaging Assembly, or AIA, and reveals some of the sun's atmosphere, the corona. Both appear at one frame every 12 hours. SDO's nearly unbroken run is now long enough to watch the rise and fall of the current solar cycle. The graph of solar activity shows the sunspot number, a measurement based on the number of individual spots and the number of sunspot groups. In this case, the line represents a smoothed 26-day average to more clearly show the overall trend.
Music: "Web of Intrigue" from Killer Tracks
Watch this video on the NASA Goddard YouTube channel.
Complete transcript available.
Our sun is ever-changing, and the Solar Dynamics Observatory has a front-row seat.
On Feb. 11, 2010, NASA launched the Solar Dynamics Observatory, also known as SDO. SDO keeps a constant eye on the sun, helping us track everything from sunspots to solar flares to other types of space weather that can have an impact on Earth. For instance, solar activity is behind the aurora, one of Earth’s most dazzling natural events.
The sun’s activity rises and falls in a pattern that lasts about 11 years on average. This is called the solar cycle. After seven years in space, SDO has had a chance to do what few other satellites have been able to do – watch the sun for the majority of a solar cycle in 11 types of light. This video shows two.
Shortened version of the time lapse with the HMI visible sun only.
Music: "Web of Intrigue" from Killer Tracks
Complete transcript available.
The time lapse portion of the video only, with more detail related to the sunspot number. This version also shows the daily sunspot number as a numerical value and as a faint graph.

SDO: Year 7 title still
Credits
Please give credit for this item to:
NASA's Goddard Space Flight Center/SDO
-
Producer
- Scott Wiessinger (USRA)
-
Technical support
- Aaron E. Lepsch (ADNET Systems, Inc.)
-
Data visualizer
- Tom Bridgman (Global Science and Technology, Inc.)
Missions
This page is related to the following missions:Series
This page can be found in the following series:Datasets used
-
SDO Continuum (Continuum) [SDO: HMI]
ID: 674 -
AIA 171 (171 Filter) [SDO: AIA]
ID: 680This dataset can be found at: http://jsoc.stanford.edu/
See all pages that use this dataset
Note: While we identify the data sets used on this page, we do not store any further details, nor the data sets themselves on our site.
Related
- ID: 12535
 Produced Video
Sources
- ID: 4551
 Visualization
Release date
This page was originally published on Saturday, February 11, 2017.
This page was last updated on Wednesday, May 3, 2023 at 1:47 PM EDT.