Shrinking Sea Ice

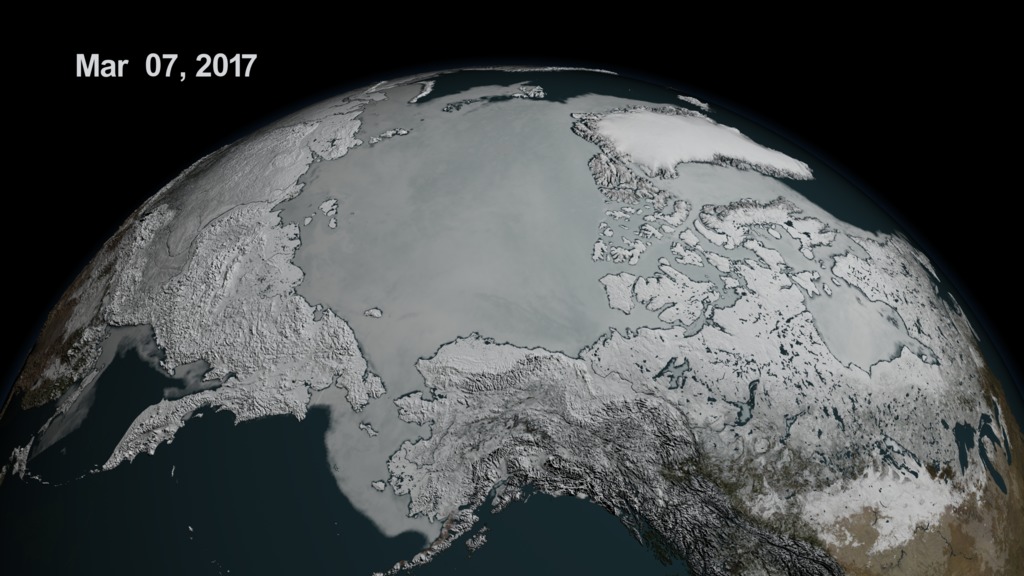
A combination of warmer-than-average temperatures, winds unfavorable to ice expansion, and a series of storms halted Arctic sea ice growth.
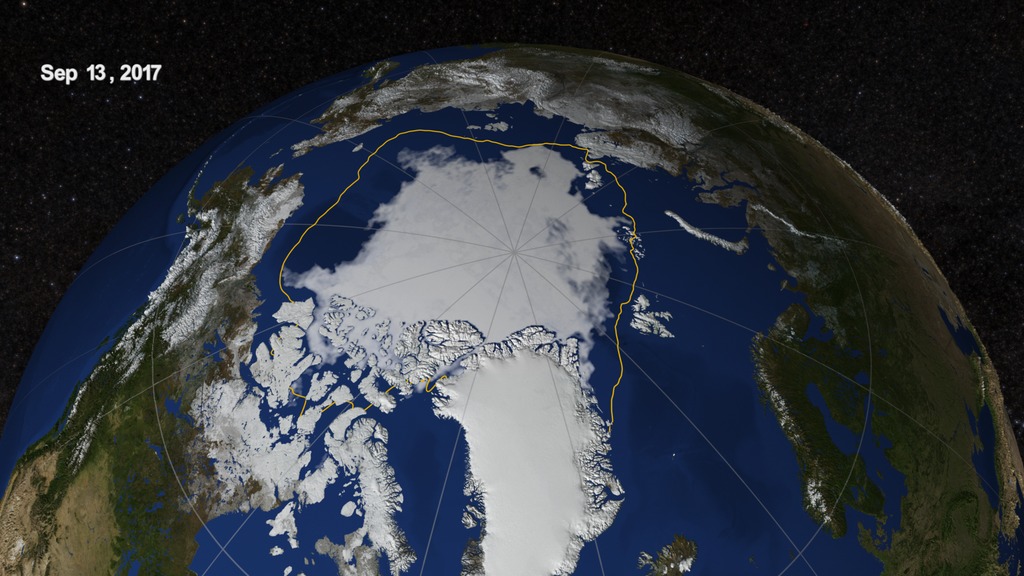
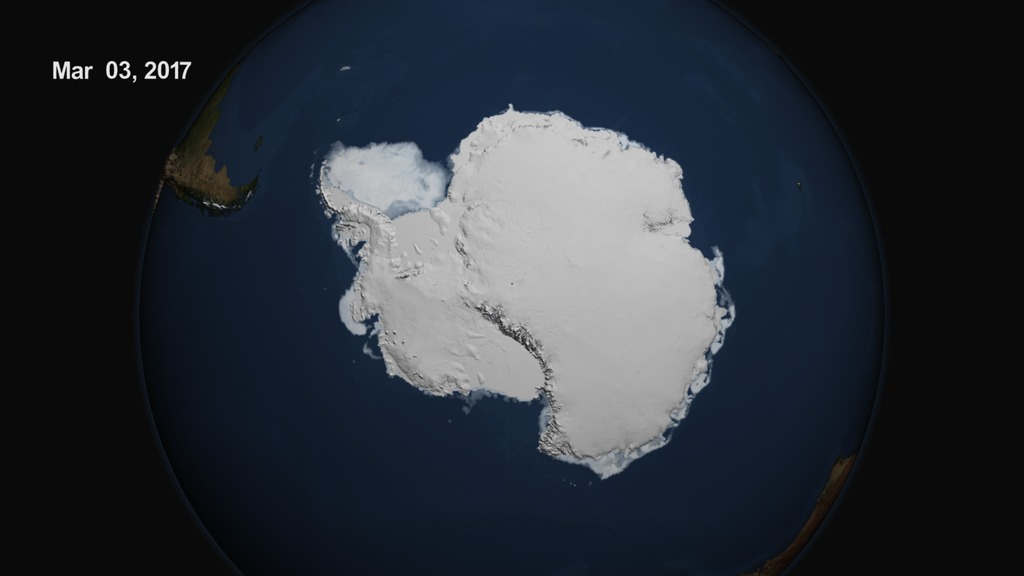
At the north pole, Arctic sea ice reached a record low wintertime maximum extent on March 7, 2017. At the south pole, sea ice around Antarctica hit its lowest extent ever recorded by satellites at the end of summer in the Southern Hemisphere on March 3. The combined Arctic and Antarctic sea ice numbers were at their lowest point since satellites began to continuously measure sea ice in 1979 – the equivalent of having lost a chunk of sea ice larger than Mexico. Scientists at NASA and the NASA-supported National Snow and Ice Data Center (NSIDC) in Boulder, Colorado use data from multiple satellites to monitor sea ice. The visualizations here use data from the AMSR2 instrument aboard the Japanese Suzaku satellite. They show the ice floating on top of the Arctic Ocean and surrounding seas shrinks in a seasonal cycle from mid-March until mid-September. As the Arctic temperatures drop in the autumn and winter, the ice cover grows again until it reaches its yearly maximum extent, typically in March. The ring of sea ice around the Antarctic continent behaves in a similar manner, with the calendar flipped: it usually reaches its maximum in September and its minimum in February. Watch the videos to learn more.
Explore how sea ice at each pole changes through the seasons
Since November, daily Antarctic sea ice extent has continuously been at its lowest levels in the satellite record.
The Arctic's sea ice maximum extent has dropped by an average of 2.8 percent per decade since 1979.
Monthly deviations and trends in polar sea ice from 1979 to 2017, measured by satellites. Antarctic gains do not offset large Arctic losses.
An iceberg surrounded by sea ice in the Bellingshausen Sea, Antarctica, as seen from aboard NASA's DC-8 scientific aircraft Oct. 22, 2016.
For More Information
See NASA.gov
Credits
Please give credit for this item to:
NASA/Goddard Space Flight Center Scientific Visualization Studio
Chart courtesy Joshua Stevens/NASA Earth Observatory
Photo courtesy John Sonntag/NASA/Operation IceBridge
-
Animator
- Lori Perkins (NASA/GSFC)
-
Producer
- Kathryn Mersmann (USRA)
-
Scientists
- Walt Meier (NASA/GSFC)
- Claire Parkinson (NASA/GSFC)
- Robert Gersten (Wyle Information Systems)
-
Writer
- Maria-Jose Vinas Garcia (Telophase)
Related
- ID: 12734
 Produced Video
 - ID: 12537
![Music: Crystal Light by Michael Holborn [PRS] and William Henries [PRS]Complete transcript available.](/vis/a010000/a012500/a012537/LARGE_MP4-12537_ArcticSeaIceMax_2017_large.00624_print.jpg) Produced Video
Produced Video
Sources
- ID: 4562
 Visualization
 - ID: 4564
Release date
This page was originally published on Monday, April 10, 2017.
This page was last updated on Wednesday, May 3, 2023 at 1:47 PM EDT.