2016 Hottest Year on Record

For the third year in a row, global warm temperatures break records in 2016.
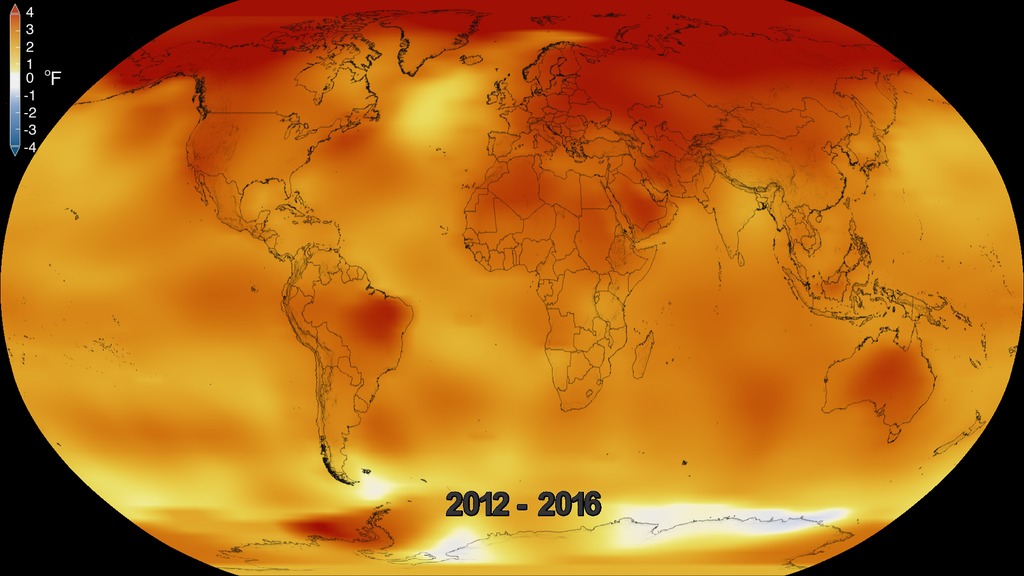
2016 was the hottest year on record, continuing a decades-long warming trend and breaking the record held by 2015, which in turn broke the record held by 2014. Scientists at NASA’s Goddard Institute for Space Studies (GISS) analyzed measurements from 6,300 weather stations, ship- and buoy-based observations of sea surface temperatures, and temperature measurements from Antarctic research stations. They found that Earth’s average surface temperature has risen about 2 degrees Fahrenheit (1.1 degrees Celsius) since the late-19th century, largely a result of human emissions into the atmosphere. Scientists at the National Oceanic and Atmospheric Administration (NOAA) separately analyzed the data and came to the same conclusion. Most of the globe’s warming has occurred in the last 35 years. Sixteen of the last 17 warmest years on record have occurred since 2001. Watch the video to see how temperatures have changed from 1880 to 2016.
Watch a progression of changing global surface temperatures anomalies from 1880 through 2016, which broke a new record.
Scientists use field observations to determine the global average surface temperature.
The chart shows every year’s annual temperature cycle from 1880 to the present, compared to the average temperature from 1980 to 2015.
For More Information
See NASA.gov
Credits
Please give credit for this item to:
NASA/Goddard Space Flight Center Scientific Visualization Studio
Temperature anomaly chart courtesy of NASA/Earth Observatory
-
Animator
- Lori Perkins (NASA/GSFC)
-
Video editors
- Kathryn Mersmann (USRA)
- Jenny Hottle (NASA/GSFC)
-
Scientist
-
Gavin A. Schmidt
(NASA/GSFC GISS)

-
Gavin A. Schmidt
(NASA/GSFC GISS)
-
Writer
- Kate Ramsayer (Telophase)
Sources
- ID: 12475
![Eight of the 12 months – from January through September, with the exception of June – were the hottest of those respective months on record. October, November and December of 2016 were the second hottest of those months on record – in all three cases, behind records set in 2015.Music credit: In Dreams We Trust by Chris White [PRS] and Guy Hatfield [PRS]Complete transcript available.](/vis/a010000/a012400/a012475/LARGE_MP4-124752016globaltemp_large.02469_print.jpg) Produced Video
Produced Video - ID: 4546
 Visualization
Release date
This page was originally published on Monday, February 6, 2017.
This page was last updated on Wednesday, May 3, 2023 at 1:47 PM EDT.