Mapping Forests Through Time

Scientists use satellites to map 25 years of forest change.
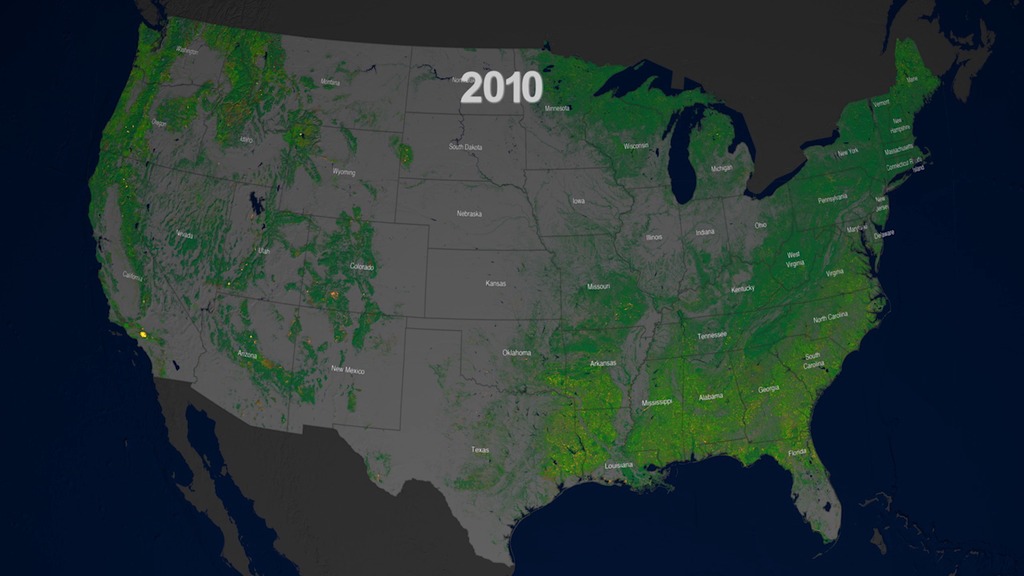
Trees are one of the world’s best absorbers of atmospheric carbon dioxide, a greenhouse gas that contributes to climate change. As climate change becomes an increasingly urgent matter, scientists seek to understand the effect of forest changes on the increase of carbon dioxide in our atmosphere. Researchers have used the U.S. Geological Survey and NASA's Landsat data to create 25 years’ worth of annual maps of the lower-48 United States. These maps illustrate disturbances in the country’s forests over time. The maps use dark green to represent undisturbed forest, bright yellow to represent forest loss or removal, and grey or brown to represent areas with few to no trees. Scientists have linked large disturbances in forestry to coinciding natural events and human activities such as deforestation and mining. Logging and hurricanes have had a large impact on the Southeast, while fires and insect invasions have damaged forests in the West. Watch the video to learn more.
Researchers use Landsat data to create annual maps of the lower-48 United States from 1986 to 2010.
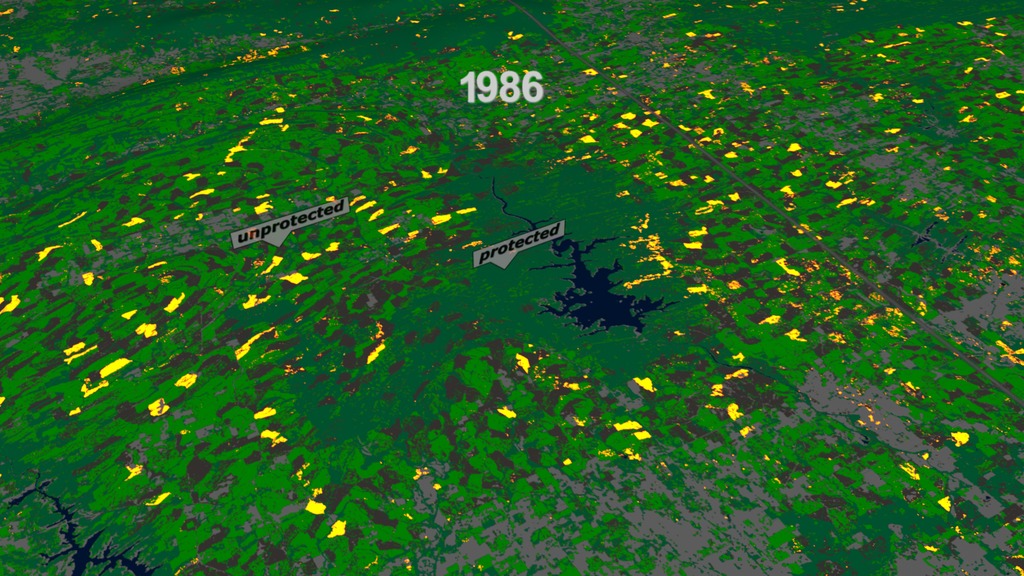
As expected, protected areas undergo much lower levels of disturbance than unprotected areas of forest.
Damage from Yellowstone’s 1988 fire is yellow and orange. Climate change is predicted to increase the intensity and frequency of wild fires.
Hurricane Hugo swept down trees in its path when it made landfall in South Carolina in 1990.
The tree coverage at this mountain top mine in West Virginia became increasingly sparse over 25 years.
Credits
Please give credit for this item to:
NASA's Scientific Visualization Studio
-
Animator
-
Greg Shirah
(NASA/GSFC)

-
Greg Shirah
(NASA/GSFC)
-
Scientists
- Jeffrey Masek (NASA/GSFC)
- Chengquan Huang (University of Maryland)
- Feng Zhao (University of Maryland)
-
Writer
- Caitlin Trenkle (Experiential Learning Program, UMD)
-
Producers
- Matthew R. Radcliff (USRA)
- Joy Ng (USRA)
Sources
- ID: 12051
 Produced Video
 - ID: 4399
Release date
This page was originally published on Wednesday, April 17, 2019.
This page was last updated on Wednesday, May 3, 2023 at 1:46 PM EDT.