NASA's Fermi Mission Broadens its Dark Matter Search
 coming from a bright source like NGC 1275 in the Perseus galaxy cluster should form a particular type of spectrum (right). Bottom: Gamma rays convert into hypothetical axion-like particles (green dashes) and back again when they encounter magnetic fields (gray curves). The resulting gamma-ray spectrum (lower curve at right) would show unusual steps and gaps not seen in Fermi data, which means a range of these particles cannot make up a portion of dark matter.Credit: SLAC National Accelerator Laboratory/Chris Smith")
Top: Gamma rays (magenta lines) coming from a bright source like NGC 1275 in the Perseus galaxy cluster should form a particular type of spectrum (right). Bottom: Gamma rays convert into hypothetical axion-like particles (green dashes) and back again when they encounter magnetic fields (gray curves). The resulting gamma-ray spectrum (lower curve at right) would show unusual steps and gaps not seen in Fermi data, which means a range of these particles cannot make up a portion of dark matter.
Credit: SLAC National Accelerator Laboratory/Chris Smith
Dark matter, the mysterious substance that constitutes most of the material universe, remains as elusive as ever. Although experiments on the ground and in space have yet to find a trace of dark matter, the results are helping scientists rule out some of the many theoretical possibilities. Three studies published earlier this year, using six or more years of data from NASA's Fermi Gamma-ray Space Telescope, have extended the mission's dark matter hunt using some novel approaches.
Dark matter neither emits nor absorbs light, primarily interacts with the rest of the universe through gravity, yet accounts for about 80 percent of the matter in the universe. Astronomers see its effects throughout the cosmos -- in the rotation of galaxies, in the distortion of light passing through galaxy clusters, and in simulations of the early universe, which require the presence of dark matter to form galaxies at all.
Among the new studies, the most exotic scenario investigated was the possibility that dark matter might consist of hypothetical particles called axions or other particles with similar properties. An intriguing aspect of axion-like particles is their ability to convert into gamma rays and back again when they interact with strong magnetic fields. These conversions would leave behind characteristic traces, like gaps or steps, in the spectrum of a bright gamma-ray source. But a study to search for these effects in gamma rays from NGC 1275, the central galaxy of the Perseus galaxy cluster, excluded a small range of axion-like particles that could have comprised about 4 percent of dark matter.
Another broad class of dark matter candidates are called Weakly Interacting Massive Particles (WIMPs). In some versions, colliding WIMPs either mutually annihilate or produce an intermediate, quickly decaying particle. Both scenarios result in gamma rays that can be detected by the LAT.
In another study, scientists determined that the distribution of dark matter in the Small Magellanic Cloud (SMC), the second-largest of the small satellite galaxies orbiting our Milky Way galaxy, was enough to produce detectable signals for two WIMP types. But no signal from dark matter annihilation was found to be statistically significant.
Lastly, another team used more than 6.5 years of LAT data to analyze the background glow of gamma rays seen all over the sky. Fermi has shown that much of this light arises from unresolved gamma-ray sources, particularly galaxies called blazars, which are powered by material falling toward gigantic black holes. But some models predict that EGB gamma rays could arise from distant interactions of dark matter particles, such as the annihilation or decay of WIMPs. Instead, the new study shows that blazars and other discrete sources can account for nearly all of this emission.
Although these latest studies have come up empty-handed, the quest to find dark matter continues both in space and in ground-based experiments.
 coming from a bright source like NGC 1275 in the Perseus galaxy cluster should form a particular type of spectrum (right). Credit: SLAC National Accelerator Laboratory/Chris Smith")
Top half of two-panel animation: Gamma rays (magenta lines) coming from a bright source like NGC 1275 in the Perseus galaxy cluster should form a particular type of spectrum (right).
Credit: SLAC National Accelerator Laboratory/Chris Smith
 and back again when they encounter magnetic fields (gray curves). The resulting gamma-ray spectrum (lower curve at right) would show unusual steps and gaps not seen in Fermi data, which means a range of these particles cannot make up a portion of dark matter.Credit: SLAC National Accelerator Laboratory/Chris Smith")
Bottom half of two-panel animation. Gamma rays convert into hypothetical axion-like particles (green dashes) and back again when they encounter magnetic fields (gray curves). The resulting gamma-ray spectrum (lower curve at right) would show unusual steps and gaps not seen in Fermi data, which means a range of these particles cannot make up a portion of dark matter.
Credit: SLAC National Accelerator Laboratory/Chris Smith
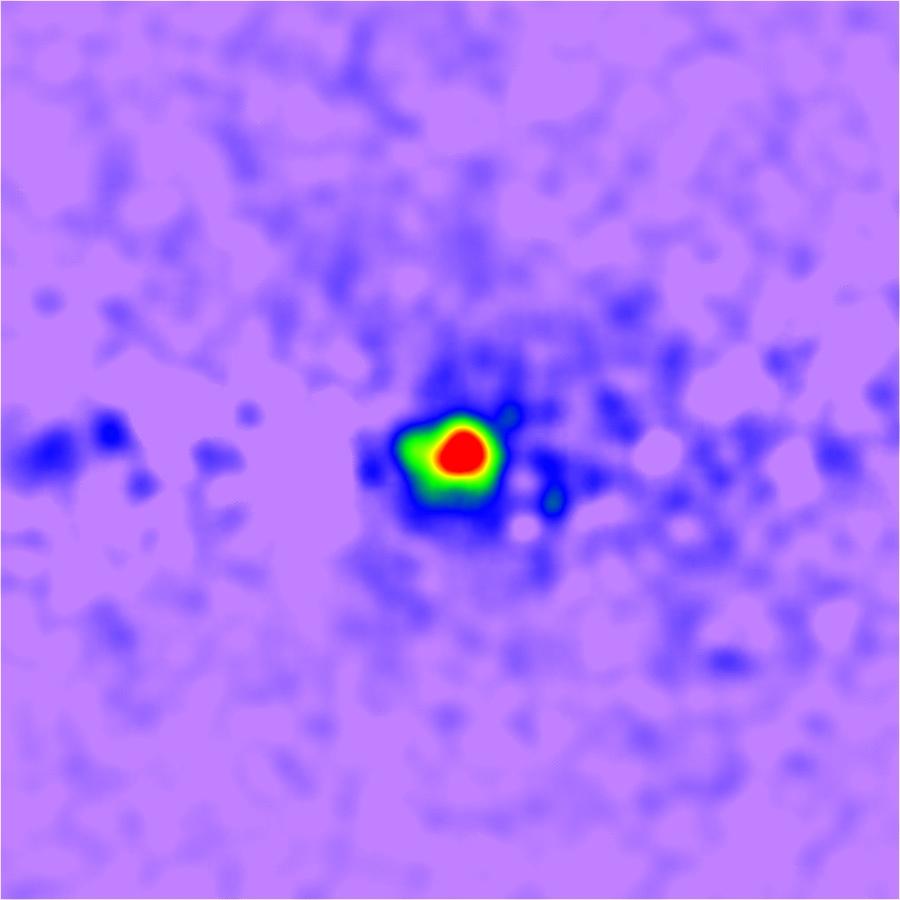
, at center, is the second-largest satellite galaxy orbiting our own. This image superimposes a photograph of the SMC with one half of a model of its dark matter (right of center). Lighter colors indicate greater density and show a strong concentration toward the galaxy's center. Ninety-five percent of the dark matter is contained within a circle tracing the outer edge of the model shown. In six years of data, Fermi finds no indication of gamma rays from the SMC's dark matter.Credits: Dark matter, R. Caputo et al. 2016; background, Axel Mellinger, Central Michigan University")
The Small Magellanic Cloud (SMC), at center, is the second-largest satellite galaxy orbiting our own. This image superimposes a photograph of the SMC with one half of a model of its dark matter (right of center). Lighter colors indicate greater density and show a strong concentration toward the galaxy's center. Ninety-five percent of the dark matter is contained within a circle tracing the outer edge of the model shown. In six years of data, Fermi finds no indication of gamma rays from the SMC's dark matter.
Credits: Dark matter, R. Caputo et al. 2016; background, Axel Mellinger, Central Michigan University
, which is located about 200,000 light-years away and is the second-largest of the small satellite galaxies orbiting our Milky Way galaxy. The bright globular cluster 47 Tucanae (NGC 104) is visible at left and lies about 17,000 light-years away. Credit: Axel Mellinger, Central Michigan University")
Visible light image of the Small Magellanic Cloud (SMC, at center), which is located about 200,000 light-years away and is the second-largest of the small satellite galaxies orbiting our Milky Way galaxy. The bright globular cluster 47 Tucanae (NGC 104) is visible at left and lies about 17,000 light-years away.
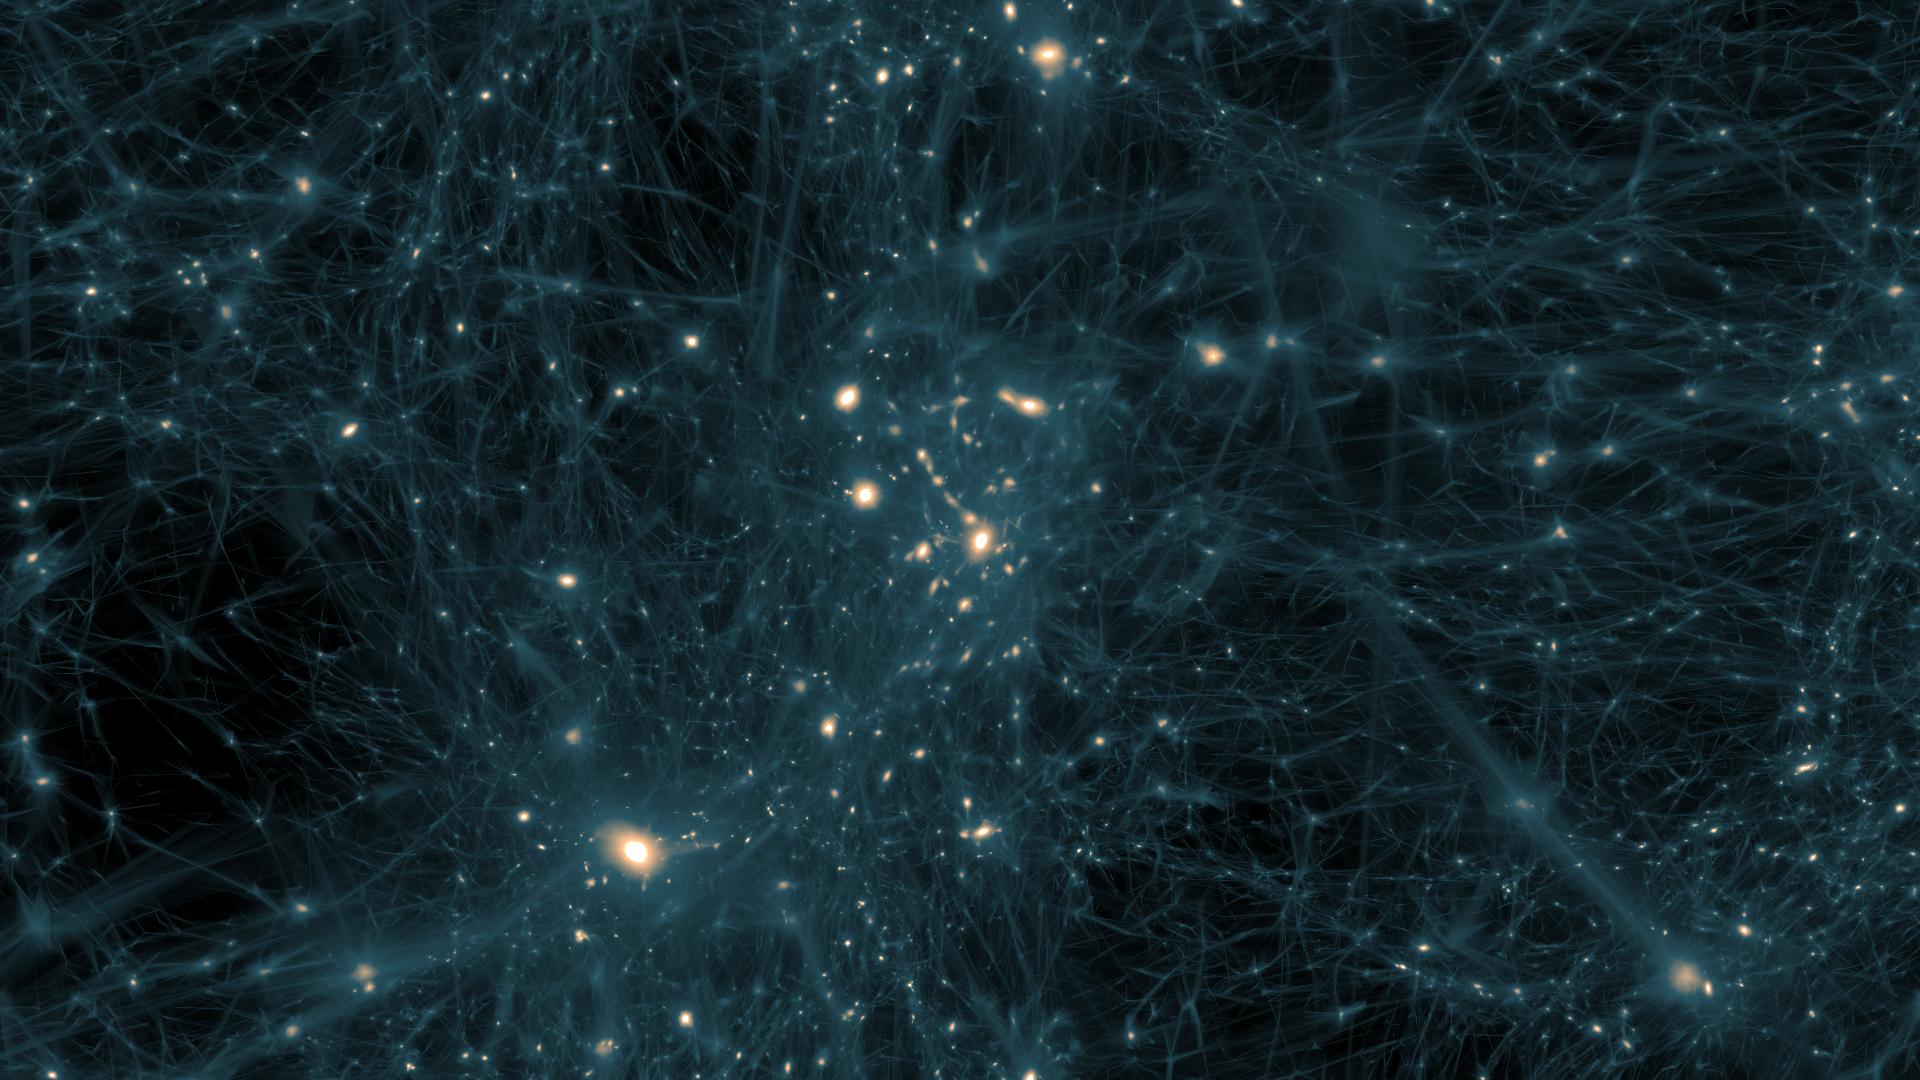
, one using the first three months of LAT data, the other showing a cumulative exposure of seven years. The blue color, representing the fewest gamma rays, includes the extragalactic gamma-ray background. Blazars make up most of the bright sources shown (colored red to white). With increasing exposure, Fermi reveals more of them. A new study shows blazars are almost completely responsible for the background glow.Credits: NASA/DOE/Fermi LAT Collaboration")
This animation switches between two images of the gamma-ray sky as seen by Fermi's Large Area Telescope (LAT), one using the first three months of LAT data, the other showing a cumulative exposure of seven years. The blue color, representing the fewest gamma rays, includes the extragalactic gamma-ray background. Blazars make up most of the bright sources shown (colored red to white). With increasing exposure, Fermi reveals more of them. A new study shows blazars are almost completely responsible for the background glow.
Credits: NASA/DOE/Fermi LAT Collaboration
, one using the first three months of LAT data, the other showing a cumulative exposure of seven years. The blue color, representing the fewest gamma rays, includes the extragalactic gamma-ray background. Blazars make up most of the bright sources shown (colored red to white). With increasing exposure, Fermi reveals more of them. A new study shows blazars are almost completely responsible for the background glow.Credits: NASA/DOE/Fermi LAT Collaboration")
Higher-quality version of the above animation. This animation switches between two images of the gamma-ray sky as seen by Fermi's Large Area Telescope (LAT), one using the first three months of LAT data, the other showing a cumulative exposure of seven years. The blue color, representing the fewest gamma rays, includes the extragalactic gamma-ray background. Blazars make up most of the bright sources shown (colored red to white). With increasing exposure, Fermi reveals more of them. A new study shows blazars are almost completely responsible for the background glow.
Credits: NASA/DOE/Fermi LAT Collaboration
For More Information
Credits
Please give credit for this item to:
NASA's Goddard Space Flight Center. However, individual items should be credited as indicated above.
-
Technical support
- Scott Wiessinger (USRA)
- Aaron E. Lepsch (ADNET Systems, Inc.)
-
Science writer
- Francis Reddy (Syneren Technologies)
-
Graphics
- Francis Reddy (Syneren Technologies)
-
Animator
- Chris Smith (SLAC)
Missions
This page is related to the following missions:Series
This page can be found in the following series:Related
- ID: 12907
![Watch this video on the NASA Goddard YouTube channel.Music credit: "Reborn" by Maksim Tyutmanov [PRS] and Victoria Beits [PRS]; Atmosphere Music Ltd PRS; Score Addiction; Killer Tracks Production Music](/vis/a010000/a012900/a012907/hubble_galaxy_without_dark_matter_thumbnail.png) Produced Video
Produced Video - ID: 11513
 Produced Video
 - ID: 10943
Release date
This page was originally published on Friday, August 12, 2016.
This page was last updated on Wednesday, May 3, 2023 at 1:48 PM EDT.