Hottest Year On Record

Scientists report record-shattering global warm temperatures in 2015.
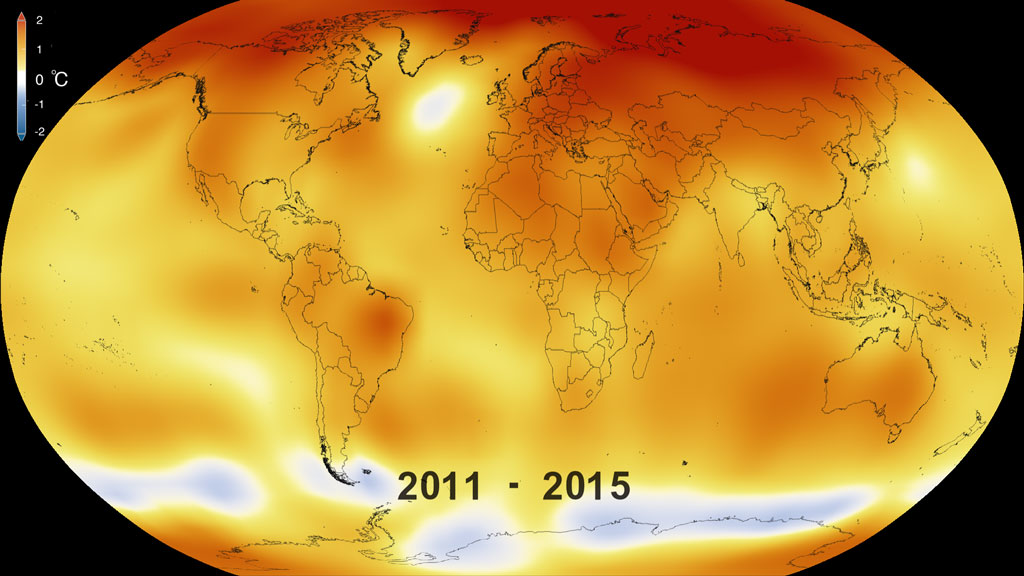
NASA and NOAA scientists report Earth’s 2015 surface temperatures were the warmest since modern record keeping began in 1880, continuing a long-term warming trend. Globally-averaged temperatures in 2015 shattered the previous mark set in 2014 by 0.23 degrees Fahrenheit. The planet’s average surface temperature has risen about 1.8 degrees Fahrenheit since the late-19th century, a change largely driven by increased carbon dioxide and other human-made emissions into the atmosphere. Most of the warming occurred in the past 35 years, with 15 of the 16 warmest years on record occurring since 2001. NASA’s analyses incorporate surface temperature measurements from 6,300 weather stations, ship- and buoy-based observations of sea surface temperatures, and temperature measurements from Antarctic research stations. The global average temperature difference is determined by comparison to a baseline period of 1951 to 1980. Watch the video to see how global temperatures have changed from 1880 through 2015.
This visualization illustrates Earth’s long-term warming trend, showing temperature changes from 1880 to 2015 as a rolling five-year average.
Since the late-19th century, Earth's average surface temperature has risen about 1.8 degrees Fahrenheit.
Despite the lower than normal temperatures (blue) seen in this map of Feb. 2015, the year was the second-warmest on record in the contiguous U.S.
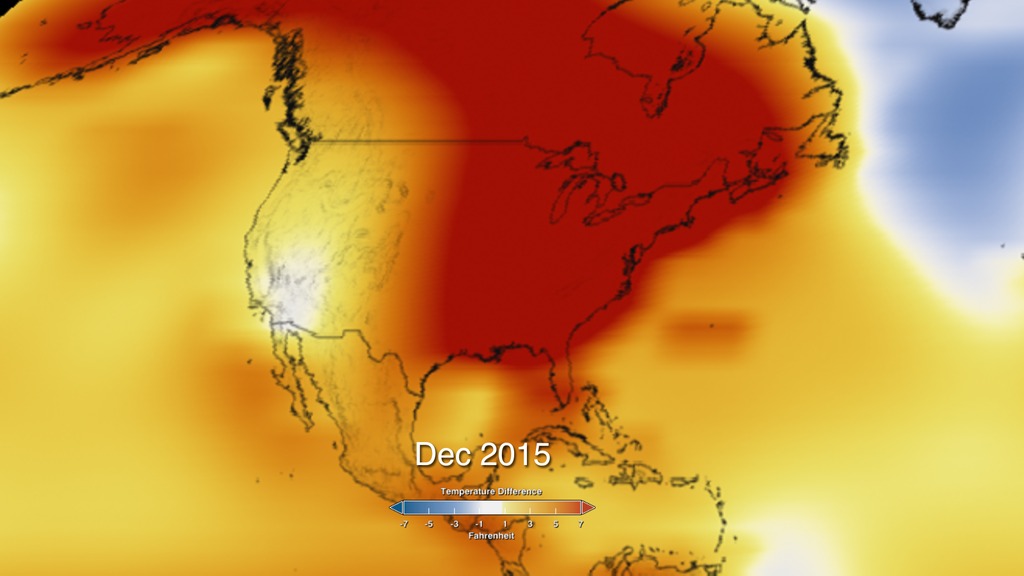
The higher than normal temperatures (red) seen in this map of Dec. 2015 led to record-warmth in cities across North America and Europe.
For More Information
See NASA.gov
Credits
Please give credit for this item to:
NASA's Scientific Visualization Studio
Text courtesy of NASA/GISS/Leslie McCarthy, Michael Cabbage
-
Writer
- None None (NASA Viz Team)
-
Animators
- Lori Perkins (NASA/GSFC)
- Krystofer Kim (USRA)
-
Scientists
-
Gavin A. Schmidt
(NASA/GSFC GISS)

-
Robert B Schmunk
(SIGMA Space Partners, LLC.)
-
Reto A. Ruedy
(SIGMA Space Partners, LLC.)
-
Gavin A. Schmidt
(NASA/GSFC GISS)
-
Producers
- Matthew R. Radcliff (USRA)
- Michelle Handleman (USRA)
- Leslie McCarthy
- Joy Ng (USRA)
Sources
- ID: 4420
 Visualization
 - ID: 12133
 Produced Video
 - ID: 4419
 Visualization
Release date
This page was originally published on Tuesday, February 2, 2016.
This page was last updated on Wednesday, May 3, 2023 at 1:48 PM EDT.