Annual Global Temperature, 1880-2015
- Produced by:
- Matthew Radcliff
- View full credits
Movies
- 2015-temperature-graph-animation-v3.webm (960x540)
- 2015-temperature-graph-animation-v3.mpeg (1280x720)
- 2015-temperature-graph-animation-v3_appletv.m4v (1280x720)
- 2015-temperature-graph-animation-v3_prores.mov (1280x720)
- 2015-temperature-graph-animation-v3_youtube_hq.mov (1920x1080)
- 2015-temperature-graph-animation-v3_ipod_sm.mp4 (320x240)
Images
- 2015-temperature-graph-animation-v3_youtube_hq_print.jpg (1024x576)
- 2015-temperature-graph-animation-v3_youtube_hq_print_thm.png (80x40)
- 2015-temperature-graph-animation-v3_youtube_hq_print_searchweb.png (320x180)
Right click movies to download them if they automatically play in your browser.
Graph of annual global temperatures, with respect to a baseline from the 19th century (the average of global annual temperatures from 1880-1899). In Fahrenheit.
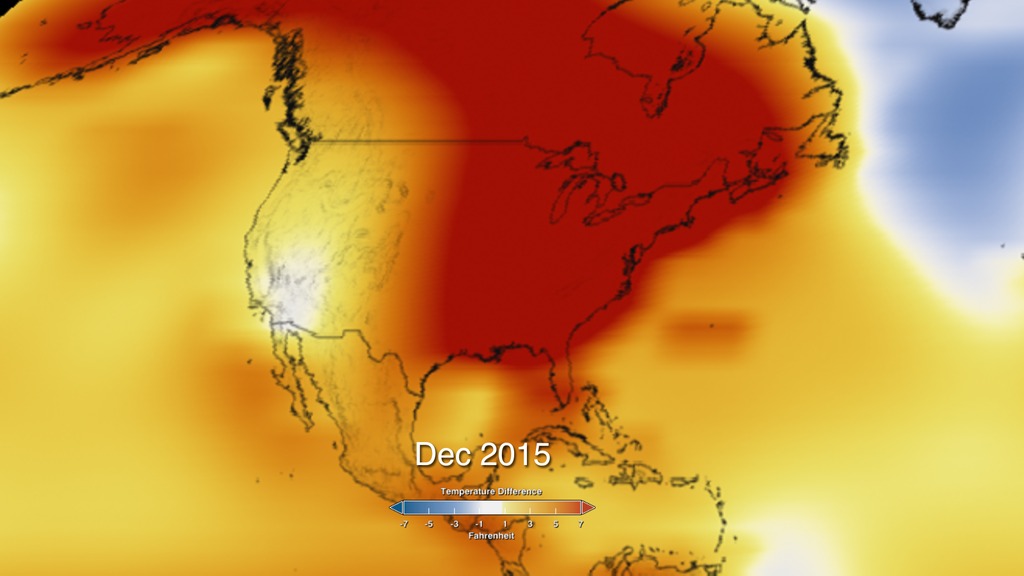
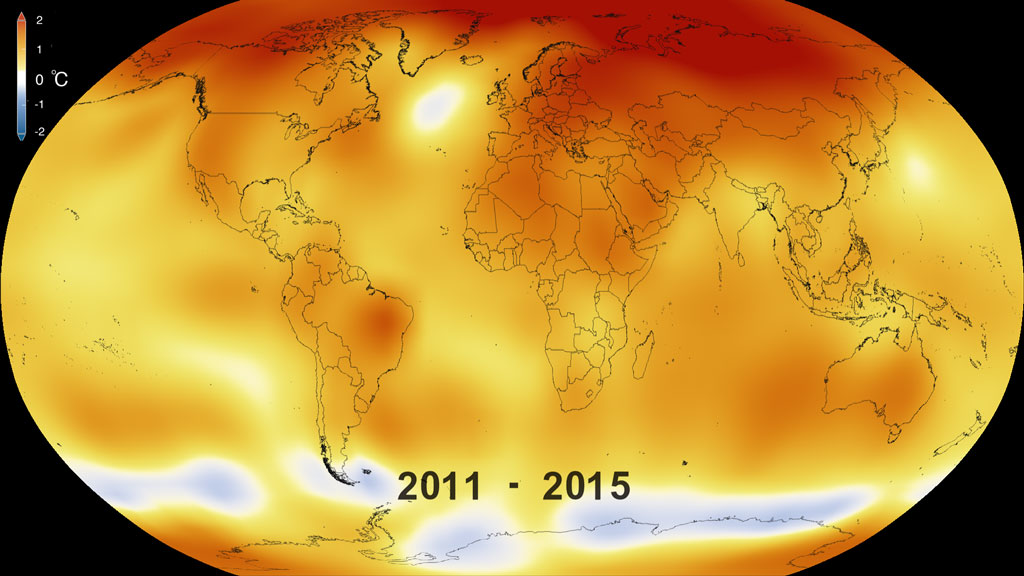
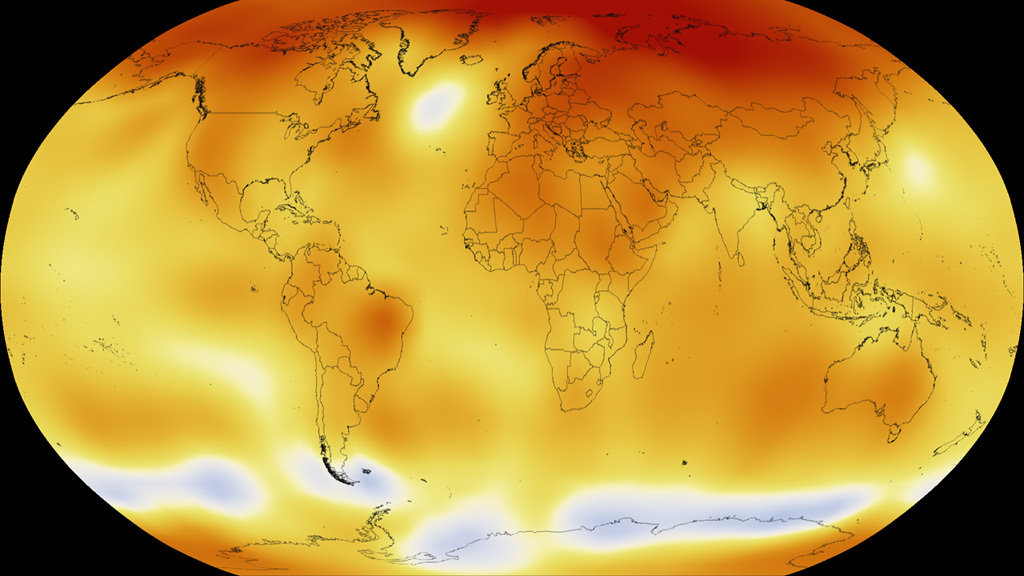
Credits
Please give credit for this item to:
NASA's Goddard Space Flight Center
Animator
- Krystofer Kim (KBRwyle)
Scientist
- Gavin A. Schmidt (NASA/GSFC GISS)
Producer
- Matthew Radcliff (KBRwyle) [Lead]
Related pages
Gavin Schmidt on 2015's Record Global Temperature
Jan. 20, 2016, 8 a.m.
Read moreGavin Schmidt, Director of the Goddard Institute for Space Studies, discusses the results of their analyses of 2015 global temperature data. Spoiler alert: it was warm. Earth s 2015 surface temperatures were the warmest since modern record keeping began in 1880, according to independent analyses by the Goddard Institute for Space Studies.Globally-averaged temperatures in 2015 shattered the previous mark set in 2014 by 0.23 degrees Fahrenheit (0.13 Celsius). Only once before, in 1998, has the new record been greater than the old record by this much. This record high temperature continues the long-term trend of increasing temperature, and brings us halfway to the 2°C ceiling agreed to at the 2015 UN Climate Conference in Paris.In these videos, NASA scientist Gavin Schmidt speaks directly about the data and what it means.
Global Temperature Anomalies from December 2015
Jan. 20, 2016, 6:30 a.m.
Read moreGlobal temperature data for December 2015, in degrees Fahrenheit, starting with North America and pulling back to reveal the whole world. The December 2015 temperatures are compared to a baseline of the 1951-1980 average temperature. Higher than normal temperatures are shown in red and lower then normal termperatures are shown in blue. Earth’s 2015 surface temperatures were the warmest since modern record keeping began in 1880, according to independent analyses by NASA and the National Oceanic and Atmospheric Administration (NOAA). Globally-averaged temperatures in 2015 shattered the previous mark set in 2014 by 0.23 degrees Fahrenheit (0.13 Celsius).Weather dynamics often affect regional temperatures, so not every region on Earth experienced record average temperatures last year. This data visualization of NASA s Goddard Institute for Space Studies (GISS) Global temperature anomalies for December of 2015 show the United States and then zooms out to show the global picture. Temperature anomalies indicate how much warmer or colder it is than normal for a particular place and time. For more information on the GISTEMP, see the GISTEMP analysis website located at: http://data.giss.nasa.gov/gistemp/ Global temperature data for December 2015, in degrees Celsius, on a spinning globe. Higher than normal temperatures are shown in red and lower then normal termperatures are shown in blue. Global temperature data for December 2015, in degrees Fahrenheit, on a spinning globe. Higher than normal temperatures are shown in red and lower then normal termperatures are shown in blue. Monthly Progresion - Global temperature anomaly monthly data are shown in degrees Fahrenheit in Robinson projection. Higher than normal temperatures are shown in red and lower then normal temperatures are shown in blue. This frame set has the 2015 monthly temperature progression like the above frameset without the date and colorbar overlay. Date overlay for the 2015 monthly progression
Five-Year Global Temperature Anomalies from 1880 to 2015
Jan. 19, 2016, 7 p.m.
Read moreThis color-coded map in Robinson projection displays a progression of changing global surface temperature anomalies from 1880 through 2015. Higher than normal temperatures are shown in red and lower then normal termperatures are shown in blue. The final frame represents the global temperatures 5-year averaged from 2011 through 2015. Scale in degree Celsius.This video is also available on our YouTube channel. Earth’s 2015 surface temperatures were the warmest since modern record keeping began in 1880, according to independent analyses by NASA and the National Oceanic and Atmospheric Administration (NOAA).Globally-averaged temperatures in 2015 shattered the previous mark set in 2014 by 0.23 degrees Fahrenheit (0.13 Celsius). Only once before, in 1998, has the new record been greater than the old record by this much.The 2015 temperatures continue a long-term warming trend, according to analyses by scientists at NASA’s Goddard Institute for Space Studies (GISS) in New York (GISTEMP). NOAA scientists agreed with the finding that 2015 was the warmest year on record based on separate, independent analyses of the data. Because weather station locations and measurements change over time, there is some uncertainty in the individual values in the GISTEMP index. Taking this into account, NASA analysis estimates 2015 was the warmest year with 94 percent certainty. “Climate change is the challenge of our generation, and NASA’s vital work on this important issue affects every person on Earth,” said NASA Administrator Charles Bolden. “Today’s announcement not only underscores how critical NASA’s Earth observation program is, it is a key data point that should make policy makers stand up and take notice - now is the time to act on climate.”The planet’s average surface temperature has risen about 1.8 degrees Fahrenheit (1.0 degree Celsius) since the late-19th century, a change largely driven by increased carbon dioxide and other human-made emissions into the atmosphere.Most of the warming occurred in the past 35 years, with 15 of the 16 warmest years on record occurring since 2001. Last year was the first time the global average temperatures were 1 degree Celsius or more above the 1880-1899 average.Phenomena such as El Niño or La Niña, which warm or cool the tropical Pacific Ocean, can contribute to short-term variations in global average temperature. A warming El Niño was in effect for most of 2015.“2015 was remarkable even in the context of the ongoing El Niño,” said GISS Director Gavin Schmidt. “Last year’s temperatures had an assist from El Niño, but it is the cumulative effect of the long-term trend that has resulted in the record warming that we are seeing.”Weather dynamics often affect regional temperatures, so not every region on Earth experienced record average temperatures last year. For example, NASA and NOAA found that the 2015 annual mean temperature for the contiguous 48 United States was the second warmest on record.The GISTEMP analysis website is located at: http://data.giss.nasa.gov/gistemp/ This color-coded map draped over the spherical Earth displays a progression of changing global surface temperature anomalies from 1880 through 2015. Higher than normal temperatures are shown in red and lower then normal termperatures are shown in blue. The final frame represents the global temperatures 5-year averaged from 2011 through 2015. Scale is in degrees Celsius. This color-coded map in Robinson projection displays a progression of changing global surface temperature anomalies from 1880 through 2014. Higher than normal temperatures are shown in red and lower then normal termperatures are shown in blue. The final frame represents the global temperatures 5-year averaged from 2010 through 2014. Scale in degrees Fahrenheit. This frame sequence of color-coded global temperature anomalies in robinson projection display a progression of changing global surface temperatures. Each image represents a unique 5 year rolling time period with no fades between datasets. Higher than normal temperatures are shown in red and lower than normal are shown in blue. Colortable in fahrenheit from -4 degrees to +4 degrees This is an abbreviated version because this movie only uses the frames from 1950 through 2015. Global temperature anomalies averaged from 1881-1885 using the colortable in fahrenheit. Global temperature anomalies averaged from 1891-1895 using the colortable in fahrenheit. Global temperature anomalies averaged from 1901-1905 using the colortable in fahrenheit. Global temperature anomalies averaged from 1911-1915 using the colortable in fahrenheit. Global temperature anomalies averaged from 1921-1925 using the colortable in fahrenheit. Global temperature anomalies averaged from 1931-1935 using the colortable in fahrenheit. Global temperature anomalies averaged from 1941-1945 using the colortable in fahrenheit. Global temperature anomalies averaged from 1951-1955 using the colortable in fahrenheit. Global temperature anomalies averaged from 1961-1965 using the colortable in fahrenheit. Global temperature anomalies averaged from 1971-1975 using the colortable in fahrenheit. Global temperature anomalies averaged from 1981-1985 using the colortable in fahrenheit. Global temperature anomalies averaged from 1991-1995 using the colortable in fahrenheit. Global temperature anomalies averaged from 2001-2005 using the colortable in fahrenheit. Global temperature anomalies averaged from 2011-2015 using the colortable in fahrenheit. Science On a Sphere version
NASA/NOAA 2015 Global Temperature Live Shots
Jan. 19, 2016, 7 p.m.
Read moreVideo file for the release of 2015 global temperature data by NASA. Contains data visualizations, graphics, and interview clips with Gavin Schmidt, the director of the Goddard Institute for Space Studies (GISS) in New York City.Complete transcript available. Earth’s 2015 surface temperatures were the warmest since modern record keeping began in 1880, according to independent analyses by NASA and the National Oceanic and Atmospheric Administration (NOAA).Globally-averaged temperatures in 2015 shattered the previous mark set in 2014 by 0.23 degrees Fahrenheit (0.13 Celsius). Only once before, in 1998, has the new record been greater than the old record by this much.The 2015 temperatures continue a long-term warming trend, according to analyses by scientists at NASA’s Goddard Institute for Space Studies (GISS) in New York (GISTEMP). NOAA scientists concur with the finding that 2015 was the warmest year on record based on separate, independent analyses of the data. Because weather station locations and measurements change over time, there is some uncertainty in the individual values in the GISTEMP index. Taking this into account, NASA analysis estimates 2015 was the warmest year with 94 percent certainty. The planet’s average surface temperature has risen about 1.8 degrees Fahrenheit (1.0 degree Celsius) since the late-19th century, a change largely driven by increased carbon dioxide and other human-made emissions into the atmosphere.Most of the warming occurred in the past 35 years, with 15 of the 16 warmest years on record occurring since 2001. Last year was the first time the global average temperatures were 1 degree Celsius or more above the 1880-1899 average.To see NASA/NOAA temperature release. B-roll for live shots Interview clips with Gavin Schmidt, Director of the Goddard Institute for Space Studies (GISS), about the 2015 global temperature data.Complete transcript available. For More InformationSee [www.nasa.gov/earth](www.nasa.gov/earth)
Untitled
Feb. 2, 2016, 6 a.m.
Read moreScientists report record-shattering global warm temperatures in 2015. This visualization illustrates Earth’s long-term warming trend, showing temperature changes from 1880 to 2015 as a rolling five-year average. Since the late-19th century, Earth s average surface temperature has risen about 1.8 degrees Fahrenheit. Despite the lower than normal temperatures (blue) seen in this map of Feb. 2015, the year was the second-warmest on record in the contiguous U.S. The higher than normal temperatures (red) seen in this map of Dec. 2015 led to record-warmth in cities across North America and Europe. For More InformationSee [NASA.gov](http://www.nasa.gov/press-release/nasa-noaa-analyses-reveal-record-shattering-global-warm-temperatures-in-2015)