Untitled
- Written by:
- None None
- Edited by:
- Scott Wiessinger
- Produced by:
- Scott Wiessinger
- View full credits

NASA’s Fermi mission provides the best view of the high-energy gamma-ray sky yet seen.
Movies
- 12019-1920vizupdate-MASTER_high.webm (960x540) [7.3 MB]
- 12019-1920vizupdate-MASTER_high.mp4 (960x540) [11.4 MB]
Images
- pf-1024.jpg (1024x576) [115.8 KB]
- pf-1024_print.jpg (1024x576) [123.0 KB]
- pf-1280.jpg (1280x720) [156.3 KB]
- pf-1920.jpg (1920x1080) [243.1 KB]
Files
- a012121_iPad_movie_12019-1920vizupdate-MASTER/12019-1920vizupdate-MASTER.m3u8 [1.4 KB]
See Fermi’s new map of the gamma-ray sky and discover some of the most energetic objects in our galaxy in this video.

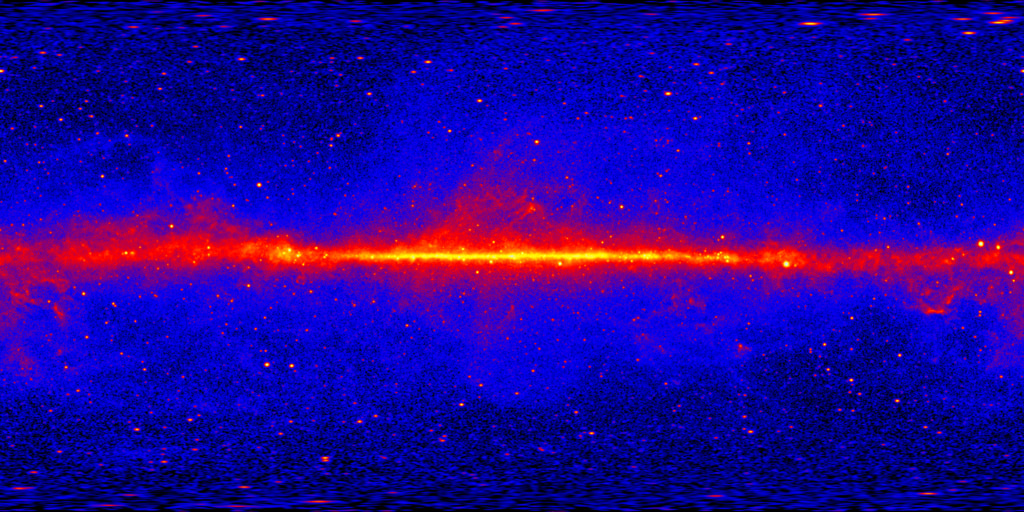
This map, constructed from Fermi data, shows how the entire sky appears at energies between 50 billion and 2 trillion electron volts.

Brighter colors indicate greater numbers of gamma rays. Labels show the highest-energy sources, all located within our galaxy.

Astronomers created the map from observations of more than 61,000 gamma rays collected over 80 months by Fermi.
For More Information
See NASA.gov
Credits
Please give credit for this item to:
NASA's Goddard Space Flight Center
Animators
- Scott Wiessinger (KBRwyle)
- Walt Feimer (KBRwyle)
Writers
- None None (NASA Viz Team) [Lead]
- Francis Reddy (University of Maryland College Park)
Video editor
- Scott Wiessinger (KBRwyle) [Lead]
Producers
- Scott Wiessinger (KBRwyle) [Lead]
- Chris Smith (KBRwyle)
Related pages
Fermi's 12-year View of the Gamma-ray Sky
Feb. 11th, 2022
Read moreThis image shows the entire sky as seen by Fermi's Large Area Telescope. The most prominent feature is the bright, diffuse glow running along the middle of the map, which marks the central plane of our Milky Way galaxy. The gamma rays there are mostly produced when energetic particles accelerated in the shock waves of supernova remnants collide with gas atoms and even light between the stars. Many of the star-like features above and below the Milky Way plane are distant galaxies powered by supermassive black holes. Many of the bright sources along the plane are pulsars. The image was constructed from 12 years of observations using front-converting gamma rays with energies greater than 1 GeV. Hammer projection.Credit: NASA/DOE/Fermi LAT Collaboration Same as above but in the equidistant cylindrical projection.Credit: NASA/DOE/Fermi LAT Collaboration This animation cycles between images that encapsulate decades of progress in gamma-ray astrophysics. The lower-resolution image shows the sky as seen by the EGRET instrument aboard NASA's Compton Gamma-Ray Observatory (1991 to 2000) using gamma rays above 100 million electron volts. Lighter colors indicate greater numbers of gamma rays. The most prominent feature is the central plane of our galaxy, which runs across the middle of the map, a result of gamma rays produced when accelerated particles strike interstellar gas and starlight. The largest yellow spot on the right side of the galactic plane is the Vela pulsar, one of five new gamma-ray pulsars EGRET discovered. The prominent reddish blob at top right is the blazar 3C 279. The all-sky map produced by Fermi's Large Area Telescope (LAT), using 12 years of data, is sharper, more detailed, and shows gamma rays of much higher ennergy than EGRET's. In its first five years, the LAT detected more than 10 times the number of gamma-ray sources seen by EGRET and had captured more high-energy gamma rays from a single source, the Vela pulsar, than the total number EGRET detected from all sources.Credit: NASA/EGRET Team and NASA/DOE/Fermi LAT Collaboration These images encapsulate decades of progress in gamma-ray astrophysics. Top: The sky as seen by the EGRET instrument aboard NASA's Compton Gamma-Ray Observatory (1991 to 2000) using gamma rays above 100 million electron volts. Lighter colors indicate greater numbers of gamma rays. The most prominent feature is the central plane of our galaxy, which runs across the middle of the map, a result of gamma rays produced when accelerated particles strike interstellar gas and starlight. The largest yellow spot on the right side of the galactic plane is the Vela pulsar, one of five new gamma-ray pulsars EGRET discovered. The prominent reddish blob at top right is the blazar 3C 279. Bottom: The all-sky map produced by Fermi's Large Area Telescope (LAT), using 12 years of data, is sharper, more detailed, and shows gamma rays of much higher ennergy than EGRET's. In its first five years, the LAT detected more than 10 times the number of gamma-ray sources seen by EGRET and had captured more high-energy gamma rays from a single source, the Vela pulsar, than the total number EGRET detected from all sources.Credit: NASA/EGRET Team and NASA/DOE/Fermi LAT Collaboration These all-sky view shows how the sky appears at energies greater than 1 billion electron volts (GeV) according to 12 years of data from NASA's Fermi Gamma-ray Space Telescope. (For comparison, the energy of visible light is between 2 and 3 electron volts.) The image contains 144 months of data from Fermi's Large Area Telescope; for better angular resolution, the map shows only gamma rays detected at the front of the instrument's tracker. Lighter colors indicate brighter gamma-ray sources. The images show the entire sky in galactic coordinates, in which the center is the center of our galaxy. The bright midplane of our galaxy runs across the images. Related pages
NASA's Fermi Mission Sharpens its High-energy View
Jan. 7th, 2016
Read moreTour the best view of the high-energy gamma-ray sky yet seen. This video highlights the plane of our galaxy and identifies objects producing gamma rays with energies greater than 1 TeV. Watch this video on the NASA Goddard YouTube channel.For complete transcript, click here.Credit: NASA's Goddard Space Flight Center This image, constructed from more than six years of observations by NASA's Fermi Gamma-ray Space Telescope, is the first to show how the entire sky appears at energies between 50 billion (GeV) and 2 trillion electron volts (TeV). For comparison, the energy of visible light falls between about 2 and 3 electron volts. A diffuse glow fills the sky and is brightest in the middle of the map, along the central plane of our galaxy. The famous Fermi Bubbles, first detected in 2010, appear as red extensions north and south of the galactic center and are much more pronounced at these energies. Discrete gamma-ray sources include pulsar wind nebulae and supernova remnants within our galaxy, as well as distant galaxies called blazars powered by supermassive black holes. Labels show the highest-energy sources, all located within our galaxy and emitting gamma rays exceeding 1 TeV. Credit: NASA/DOE/Fermi LAT Collaboration This image, constructed from more than six years of observations by NASA's Fermi Gamma-ray Space Telescope, is the first to show how the entire sky appears at energies between 50 billion (GeV) and 2 trillion electron volts (TeV). For comparison, the energy of visible light falls between about 2 and 3 electron volts. A diffuse glow fills the sky and is brightest in the middle of the map, along the central plane of our galaxy. The famous Fermi Bubbles, first detected in 2010, appear as red extensions north and south of the galactic center and are much more pronounced at these energies. Discrete gamma-ray sources include pulsar wind nebulae and supernova remnants within our galaxy, as well as distant galaxies called blazars powered by supermassive black holes. Unlabeled.Credit: NASA/DOE/Fermi LAT Collaboration Watch Fermi scientists explain why they're so excited about Pass 8, a complete reprocessing of all data collected by the mission's Large Area Telescope. This analysis increased the LAT's sensitivity, widened its energy range, and effectively sharpened its view through improved backtracking of incoming gamma rays. Watch this video on the NASA Goddard YouTube channel.For complete transcript, click here.Credit: NASA's Goddard Space Flight Center This animation compares two Fermi LAT views of the same region in the constellation Carina. The first comes from an older analysis, known as Pass 7, while the second shows the improvements with Pass 8. Both images contain the same number of gamma rays. In the foreground plot, the tall spikes represent greater concentrations of gamma rays and correspond to brightness. Pass 8 provides more accurate directions for incoming gamma rays, so more of them fall closer to their sources, creating taller spikes and a sharper image.Credit: NASA/DOE/Fermi LAT Collaboration Tour the best view of the high-energy gamma-ray sky yet seen. This video highlights the plane of our galaxy and identifies supernova remnants. Credit: NASA's Goddard Space Flight Center Still from video Still from video. No Text. Fermi Pass 7 image of the Large Magellanic Cloud with inset of Pass 8 data for brightest region. Fermi Pass 7 image of the Large Magellanic Cloud with inset of Pass 8 data for brightest region. No Text. Fermi Pass 7 image of the Large Magellanic Cloud. Has bounding box to show area where Pass 8 data is in stills above. Fermi Pass 7 image of the Large Magellanic Cloud. Major improvements to methods used to process observations from NASA's Fermi Gamma-ray Space Telescope have yielded an expanded, higher-quality set of data that allows astronomers to produce the most detailed census of the sky yet made at extreme energies. A new sky map reveals hundreds of these sources, including 12 that produce gamma rays with energies exceeding a trillion times the energy of visible light. The survey also discovered four dozen new sources that remain undetected at any other wavelength. By carefully reexamining every gamma-ray and particle detection by the LAT since Fermi's 2008 launch, scientists improved their knowledge of the detector's response to each event and to the background environment in which it was measured. This enabled the Fermi team to find many gamma rays that previously had been missed while simultaneously improving the LAT's ability to determine the directions of incoming gamma rays. The improved data, known as Pass 8, effectively sharpens the LAT's view while also significantly widening its useful energy range. Using 61,000 Pass 8 gamma rays collected over 80 months, Marco Ajello and his colleagues constructed a map of the entire sky at energies ranging from 50 billion (GeV) to 2 trillion electron volts (TeV). For comparison, the energy of visible light ranges from about 2 to 3 electron volts. The Fermi team catalogued 360 individual gamma-ray sources, about 75 percent of which are blazars -- distant galaxies sporting jets powered by supermassive black holes. The highest-energy sources, which are all located within our galaxy, are mostly the remnants of supernova explosions and pulsar wind nebulae, places where rapidly rotating neutron stars accelerate particles to near the speed of light. A famous example, the Crab Nebula, tops the list of the highest-energy Fermi sources, producing a steady drizzle of gamma rays exceeding 1 TeV.Astronomers think these very high-energy gamma rays are produced when lower-energy light collides with accelerated particles. This results in a small energy loss for the particle and a big gain for the light, transforming it into a gamma ray. For the first time, Fermi data now extend to energies previously seen only by ground-based detectors. Because ground-based telescopes have much smaller fields of view than the LAT, which scans the whole sky every three hours, they have detected only about a quarter of the objects in the new catalog. This study provides ground facilities with more than 280 new targets for follow-up observations. For More InformationSee [http://www.nasa.gov/feature/goddard/2016/nasas-fermi-space-telescope-sharpens-its-high-energy-vision/](http://www.nasa.gov/feature/goddard/2016/nasas-fermi-space-telescope-sharpens-its-high-energy-vision/) Related pages