NASA's Fermi Mission Sharpens its High-energy View
Tour the best view of the high-energy gamma-ray sky yet seen. This video highlights the plane of our galaxy and identifies objects producing gamma rays with energies greater than 1 TeV.
Watch this video on the NASA Goddard YouTube channel.
For complete transcript, click here.
Credit: NASA's Goddard Space Flight Center
Major improvements to methods used to process observations from NASA's Fermi Gamma-ray Space Telescope have yielded an expanded, higher-quality set of data that allows astronomers to produce the most detailed census of the sky yet made at extreme energies. A new sky map reveals hundreds of these sources, including 12 that produce gamma rays with energies exceeding a trillion times the energy of visible light. The survey also discovered four dozen new sources that remain undetected at any other wavelength.
By carefully reexamining every gamma-ray and particle detection by the LAT since Fermi's 2008 launch, scientists improved their knowledge of the detector's response to each event and to the background environment in which it was measured. This enabled the Fermi team to find many gamma rays that previously had been missed while simultaneously improving the LAT's ability to determine the directions of incoming gamma rays. The improved data, known as Pass 8, effectively sharpens the LAT's view while also significantly widening its useful energy range.
Using 61,000 Pass 8 gamma rays collected over 80 months, Marco Ajello and his colleagues constructed a map of the entire sky at energies ranging from 50 billion (GeV) to 2 trillion electron volts (TeV). For comparison, the energy of visible light ranges from about 2 to 3 electron volts.
The Fermi team catalogued 360 individual gamma-ray sources, about 75 percent of which are blazars -- distant galaxies sporting jets powered by supermassive black holes. The highest-energy sources, which are all located within our galaxy, are mostly the remnants of supernova explosions and pulsar wind nebulae, places where rapidly rotating neutron stars accelerate particles to near the speed of light. A famous example, the Crab Nebula, tops the list of the highest-energy Fermi sources, producing a steady drizzle of gamma rays exceeding 1 TeV.
Astronomers think these very high-energy gamma rays are produced when lower-energy light collides with accelerated particles. This results in a small energy loss for the particle and a big gain for the light, transforming it into a gamma ray.
For the first time, Fermi data now extend to energies previously seen only by ground-based detectors. Because ground-based telescopes have much smaller fields of view than the LAT, which scans the whole sky every three hours, they have detected only about a quarter of the objects in the new catalog. This study provides ground facilities with more than 280 new targets for follow-up observations.
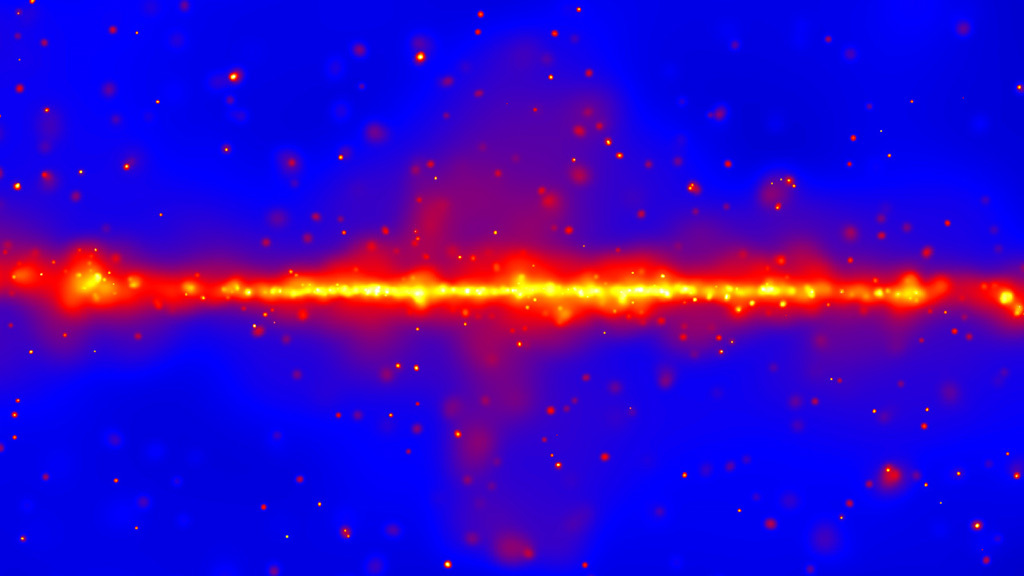
 and 2 trillion electron volts (TeV). For comparison, the energy of visible light falls between about 2 and 3 electron volts. A diffuse glow fills the sky and is brightest in the middle of the map, along the central plane of our galaxy. The famous Fermi Bubbles, first detected in 2010, appear as red extensions north and south of the galactic center and are much more pronounced at these energies. Discrete gamma-ray sources include pulsar wind nebulae and supernova remnants within our galaxy, as well as distant galaxies called blazars powered by supermassive black holes. Labels show the highest-energy sources, all located within our galaxy and emitting gamma rays exceeding 1 TeV. Credit: NASA/DOE/Fermi LAT Collaboration")
This image, constructed from more than six years of observations by NASA's Fermi Gamma-ray Space Telescope, is the first to show how the entire sky appears at energies between 50 billion (GeV) and 2 trillion electron volts (TeV). For comparison, the energy of visible light falls between about 2 and 3 electron volts. A diffuse glow fills the sky and is brightest in the middle of the map, along the central plane of our galaxy. The famous Fermi Bubbles, first detected in 2010, appear as red extensions north and south of the galactic center and are much more pronounced at these energies. Discrete gamma-ray sources include pulsar wind nebulae and supernova remnants within our galaxy, as well as distant galaxies called blazars powered by supermassive black holes. Labels show the highest-energy sources, all located within our galaxy and emitting gamma rays exceeding 1 TeV.
Credit: NASA/DOE/Fermi LAT Collaboration
 and 2 trillion electron volts (TeV). For comparison, the energy of visible light falls between about 2 and 3 electron volts. A diffuse glow fills the sky and is brightest in the middle of the map, along the central plane of our galaxy. The famous Fermi Bubbles, first detected in 2010, appear as red extensions north and south of the galactic center and are much more pronounced at these energies. Discrete gamma-ray sources include pulsar wind nebulae and supernova remnants within our galaxy, as well as distant galaxies called blazars powered by supermassive black holes. Unlabeled.Credit: NASA/DOE/Fermi LAT Collaboration")
This image, constructed from more than six years of observations by NASA's Fermi Gamma-ray Space Telescope, is the first to show how the entire sky appears at energies between 50 billion (GeV) and 2 trillion electron volts (TeV). For comparison, the energy of visible light falls between about 2 and 3 electron volts. A diffuse glow fills the sky and is brightest in the middle of the map, along the central plane of our galaxy. The famous Fermi Bubbles, first detected in 2010, appear as red extensions north and south of the galactic center and are much more pronounced at these energies. Discrete gamma-ray sources include pulsar wind nebulae and supernova remnants within our galaxy, as well as distant galaxies called blazars powered by supermassive black holes. Unlabeled.
Credit: NASA/DOE/Fermi LAT Collaboration
Watch Fermi scientists explain why they're so excited about Pass 8, a complete reprocessing of all data collected by the mission's Large Area Telescope. This analysis increased the LAT's sensitivity, widened its energy range, and effectively sharpened its view through improved backtracking of incoming gamma rays.
Watch this video on the NASA Goddard YouTube channel.
For complete transcript, click here.
Credit: NASA's Goddard Space Flight Center

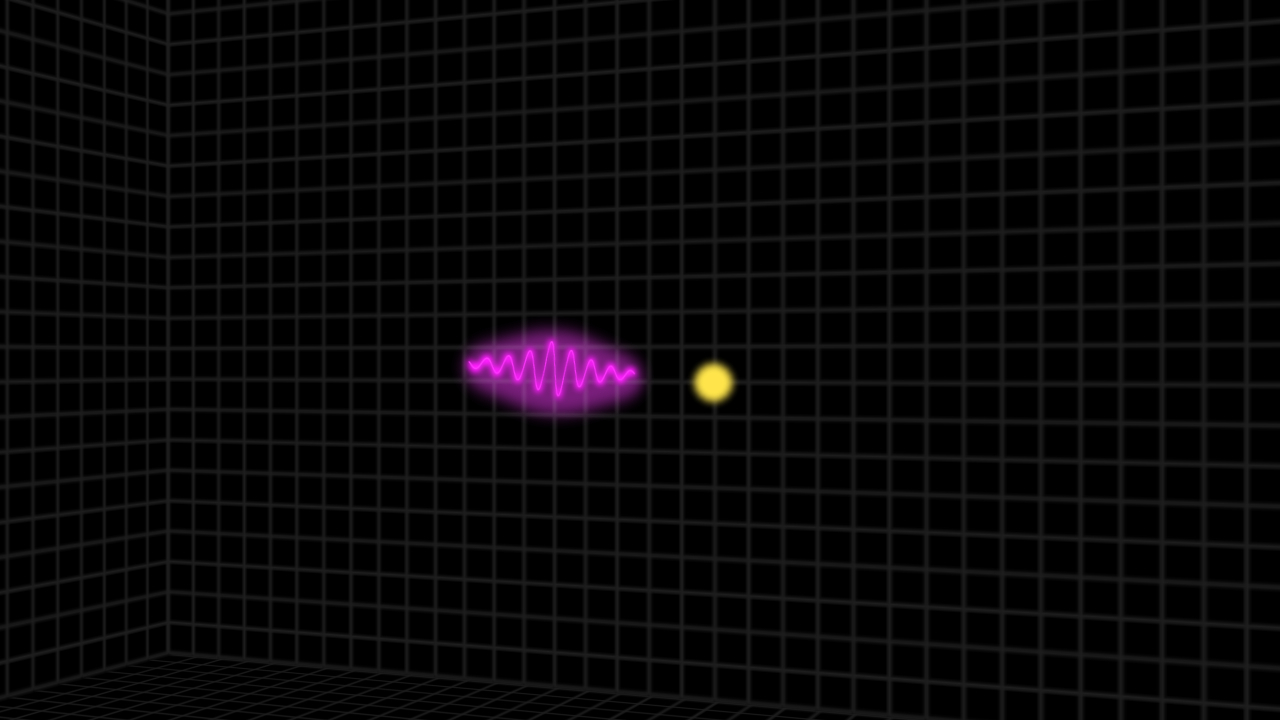
This animation compares two Fermi LAT views of the same region in the constellation Carina. The first comes from an older analysis, known as Pass 7, while the second shows the improvements with Pass 8. Both images contain the same number of gamma rays. In the foreground plot, the tall spikes represent greater concentrations of gamma rays and correspond to brightness. Pass 8 provides more accurate directions for incoming gamma rays, so more of them fall closer to their sources, creating taller spikes and a sharper image.
Credit: NASA/DOE/Fermi LAT Collaboration
Tour the best view of the high-energy gamma-ray sky yet seen. This video highlights the plane of our galaxy and identifies supernova remnants.
Credit: NASA's Goddard Space Flight Center

Still from video
Still from video. No Text.

Fermi Pass 7 image of the Large Magellanic Cloud with inset of Pass 8 data for brightest region.

Fermi Pass 7 image of the Large Magellanic Cloud with inset of Pass 8 data for brightest region. No Text.

Fermi Pass 7 image of the Large Magellanic Cloud. Has bounding box to show area where Pass 8 data is in stills above.

Fermi Pass 7 image of the Large Magellanic Cloud.
For More Information
Credits
Please give credit for this item to:
NASA's Goddard Space Flight Center. However, individual items should be credited as indicated above.
-
Producers
- Scott Wiessinger (USRA)
- Chris Smith (Self)
-
Science writer
- Francis Reddy (Syneren Technologies)
-
Animators
- Walt Feimer (HTSI)
- Scott Wiessinger (USRA)
-
Videographers
- Rob Andreoli (Advocates in Manpower Management, Inc.)
- John Caldwell (Advocates in Manpower Management, Inc.)
- Chris Smith (Self)
-
Editor
- Scott Wiessinger (USRA)
-
Interviewees
- Julie McEnery (NASA/GSFC)
- Philippe Bruel (LLR)
- Matthew Wood (SLAC)
Missions
This page is related to the following missions:Series
This page can be found in the following series:Tapes
The media on this page originally appeared on the following tapes:-
Pass 8
(ID: 2015083)
Monday, November 9, 2015 at 5:00AM
Produced by - Robert Crippen (NASA)
Datasets used
-
[Fermi: LAT]
ID: 216Fermi Gamma-ray Large Area Space Telescope (GLAST) Large Area Telescope (LAT)
This dataset can be found at: http://fermi.gsfc.nasa.gov
See all pages that use this dataset -
[Fermi]
ID: 687
Note: While we identify the data sets used on this page, we do not store any further details, nor the data sets themselves on our site.
Related
- ID: 12121
 Produced Video
 - ID: 10688
 Produced Video
 - ID: 10690
 Produced Video
Release date
This page was originally published on Thursday, January 7, 2016.
This page was last updated on Thursday, April 24, 2025 at 12:24 AM EDT.