Arctic Sea Ice Reaches 2015 Minimum Extent
For complete transcript, click here.
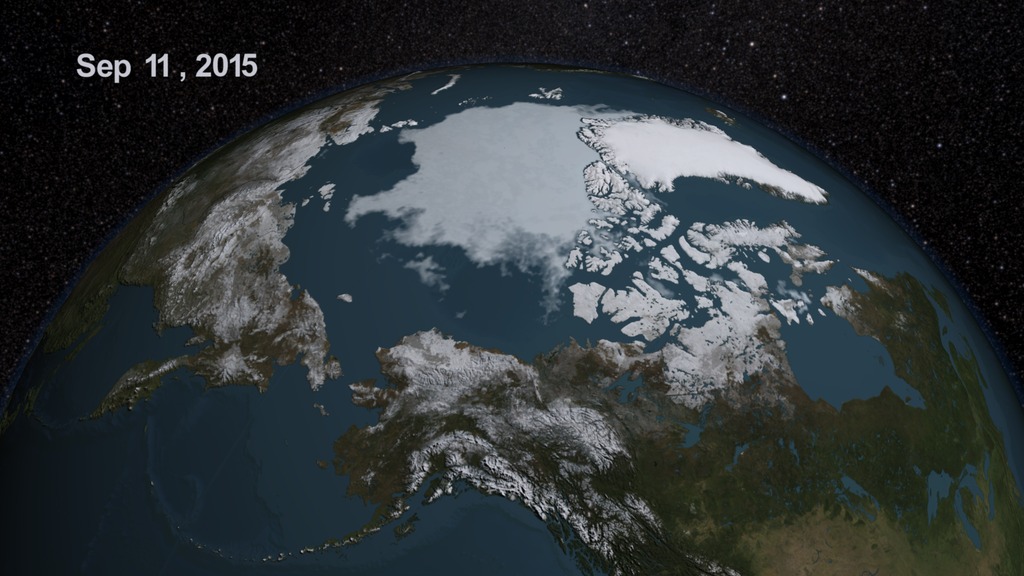
In this animation, the Earth rotates slowly as the Arctic sea ice advances over time from February 25, 2015 to September 11, 2015.
In this animation, the Earth rotates slowly as the Arctic sea ice advances over time from February 25, 2015 to September 11, 2015. The dates are not included in this version.

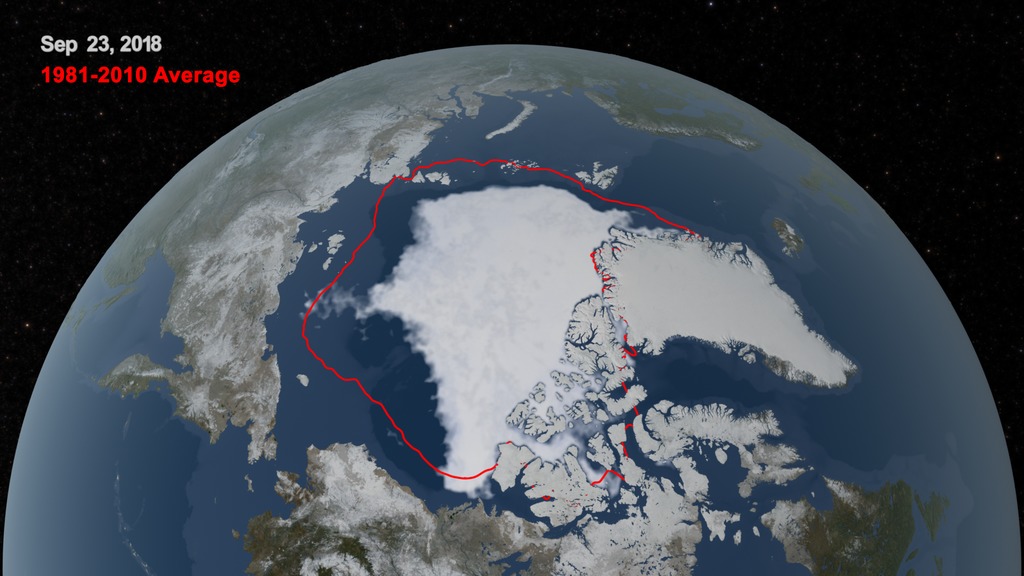
A print-resolution image of the Arctic sea ice on September 11, 2015, when the ice reached its annual minimum.
A print-resolution image of the Arctic sea ice on September 11, 2015, when the ice reached its annual minimum. In addition, a gold line marks the 30-year average sea ice extent over the time period from 1981 through 2010.
For More Information
Credits
Please give credit for this item to:
NASA's Goddard Space Flight Center
-
Data visualizer
-
Cindy Starr
(Global Science and Technology, Inc.)

-
Cindy Starr
(Global Science and Technology, Inc.)
-
Producer
- Sophia Roberts (USRA)
Series
This page can be found in the following series:Related
- ID: 12178
 Produced Video
Sources
- ID: 4684
 Visualization
 - ID: 4355
 Visualization
Release date
This page was originally published on Tuesday, September 15, 2015.
This page was last updated on Wednesday, May 3, 2023 at 1:49 PM EDT.