Fermi Spots a Record Flare from Blazar 3C 279
This visualization shows gamma rays detected during 3C 279's big flare by the LAT instrument on NASA's Fermi satellite. The flare is an abrupt shower of "rain" that trails off toward the end of the movie. Gamma rays are represented as expanding circles reminiscent of raindrops on water. Both the maximum size of the circle and its color represent the energy of the gamma ray, with white lowest and magenta highest. The highest-energy gamma ray the LAT detected during this flare, 52 billion electron volts, arrives near the end. In a second version of the visualization, a background map shows how the LAT detects 3C 279 and other sources by accumulating high-energy photons over time (brighter squares reflect higher numbers of gamma rays). The movie starts on June 14 and ends June 17. The area shown is a region of the sky five degrees on a side and centered on the position of 3C 279.
Credit: NASA/DOE/Fermi LAT Collaboration
Watch this video on the NASA Goddard YouTube channel.
For complete transcript, click here.
Five billion years ago, a great disturbance rocked a region near the monster black hole at the center of galaxy 3C 279. On June 14, the pulse of high-energy light produced by this event finally arrived at Earth, setting off detectors aboard NASA's Fermi Gamma-ray Space Telescope and other satellites. Astronomers around the world turned instruments toward the galaxy to observe this brief but record-setting flare in greater detail.
3C 279 is a famous blazar, a galaxy whose high-energy activity is powered by a central supermassive black hole weighing up to a billion times the sun's mass and roughly the size of our planetary system. As matter falls toward the black hole, some particles race away at nearly the speed of light along a pair of jets pointed in opposite directions. What makes a blazar so bright is that one of these particle jets happens to be aimed almost straight at us.
The brightest persistent source in the gamma-ray sky is the Vela pulsar, which is about 1,000 light-years away. 3C 279 is millions of times farther off, but during this flare it became four times brighter than Vela. This corresponds to a tremendous energy release, and one that cannot be sustained for long.
The galaxy rapidly brightened in less than a day, peaked on June 16, and dimmed to normal gamma-ray levels by June 18. The rapid fading is why astronomers rush to collect data as soon as they detect a blazar flare.
The Italian Space Agency's AGILE gamma-ray satellite first reported the flare, followed by Fermi. Rapid follow-up observations were made by NASA's Swift satellite and the European Space Agency's INTEGRAL spacecraft, which just happened to be looking in the right direction, along with optical and radio telescopes on the ground.
 on NASA's Fermi satellite. Gamma rays with energies from 100 million to 100 billion electron volts (eV) are shown; for comparison, visible light has energies between 2 and 3 eV. The image spans 150 degrees, is shown in a stereographic projection, and represents an exposure from June 11 at 00:28 UT to June 17 at 08:17 UT. The scale bar at left shows an angular distance of 10 degrees, which is about the width of a clenched fist at arm's length. During the flare, the blazar outshone the Vela pulsar, usually the brightest object in the gamma-ray sky. Credit: NASA/DOE/Fermi LAT Collaboration")
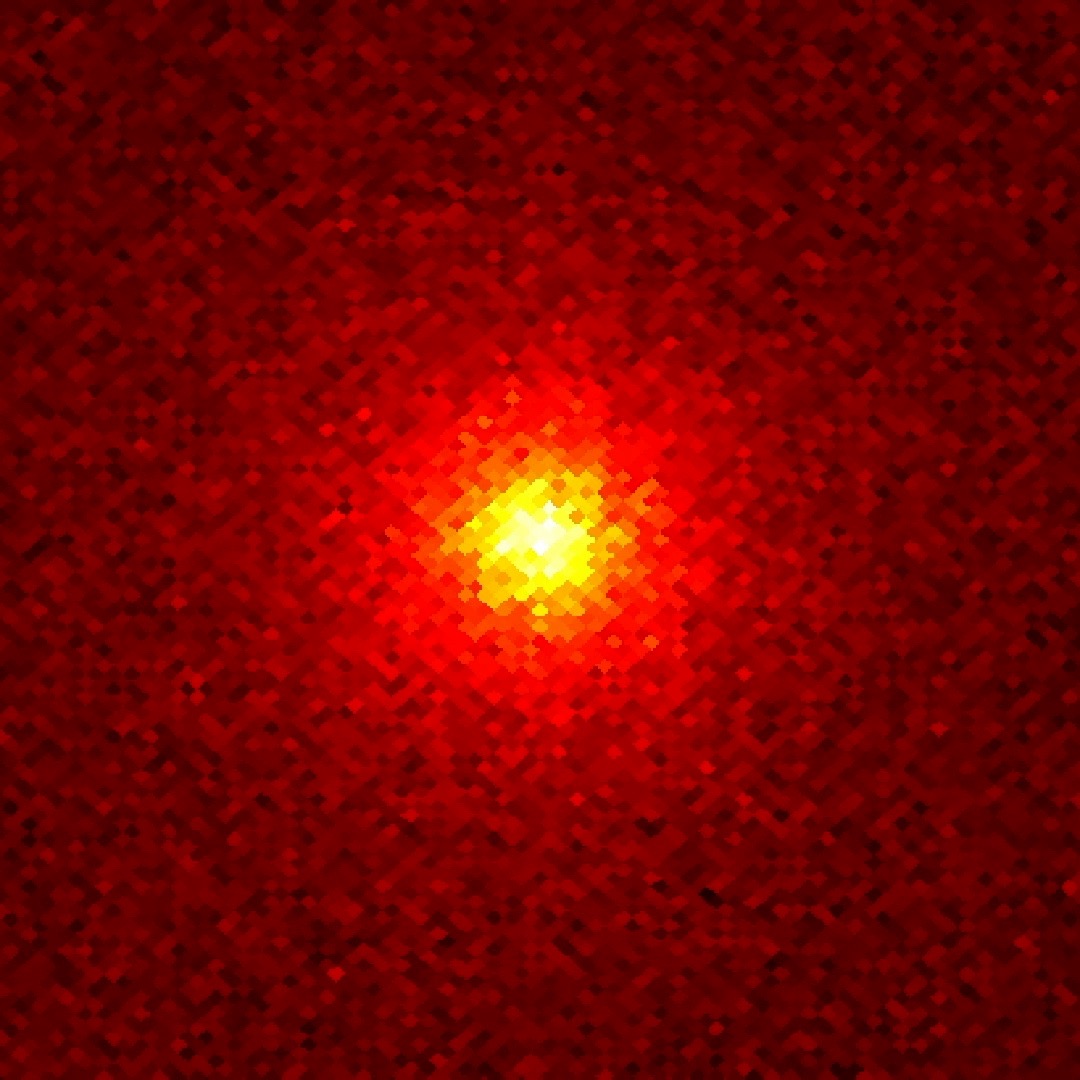
Labeled version. Blazar 3C 279's historic gamma-ray flare can be seen in this image from the Large Area Telescope (LAT) on NASA's Fermi satellite. Gamma rays with energies from 100 million to 100 billion electron volts (eV) are shown; for comparison, visible light has energies between 2 and 3 eV. The image spans 150 degrees, is shown in a stereographic projection, and represents an exposure from June 11 at 00:28 UT to June 17 at 08:17 UT. The scale bar at left shows an angular distance of 10 degrees, which is about the width of a clenched fist at arm's length. During the flare, the blazar outshone the Vela pulsar, usually the brightest object in the gamma-ray sky.
Credit: NASA/DOE/Fermi LAT Collaboration
 on NASA's Fermi satellite. Gamma rays with energies from 100 million to 100 billion electron volts (eV) are shown; for comparison, visible light has energies between 2 and 3 eV. The image spans 150 degrees, is shown in a stereographic projection, and represents an exposure from June 11 at 00:28 UT to June 17 at 08:17 UT.Credit: NASA/DOE/Fermi LAT Collaboration")
Unlabeled version. Blazar 3C 279's historic gamma-ray flare can be seen in this image from the Large Area Telescope (LAT) on NASA's Fermi satellite. Gamma rays with energies from 100 million to 100 billion electron volts (eV) are shown; for comparison, visible light has energies between 2 and 3 eV. The image spans 150 degrees, is shown in a stereographic projection, and represents an exposure from June 11 at 00:28 UT to June 17 at 08:17 UT.
Credit: NASA/DOE/Fermi LAT Collaboration

This is how the gamma-ray sky looked before the big flare from blazar 3C 279. The image spans 150 degrees, is shown in a stereographic projection, and represents roughly a one-week exposure, from June 4 at 07:00 UT to June 10 at 23:57 UT. The energy range displayed is identical to the images above. The Vela pulsar, at lower right, is the brightest persistent source in the gamma-ray sky.
Credit: NASA/DOE/Fermi LAT Collaboration

GIF of the flare arrival. This visualization shows gamma rays detected during 3C 279's big flare by the LAT instrument on NASA's Fermi satellite. The flare is an abrupt shower of "rain" that trails off toward the end of the movie. Gamma rays are represented as expanding circles reminiscent of raindrops on water. Both the maximum size of the circle and its color represent the energy of the gamma ray, with white lowest and magenta highest. The area shown is a region of the sky five degrees on a side and centered on the position of 3C 279.
Credit: NASA/DOE/Fermi LAT Collaboration
Frames and video for background map showing how the LAT detects 3C 279 and other sources by accumulating high-energy photons over time (brighter squares reflect higher numbers of gamma rays). The movie starts on June 14 and ends June 17. The area shown is a region of the sky five degrees on a side and centered on the position of 3C 279.
Credit: NASA/DOE/Fermi LAT Collaboration
Frames and video show gamma rays detected during 3C 279's big flare by the LAT instrument on NASA's Fermi satellite. The flare is an abrupt shower of "rain" that trails off toward the end of the movie. Gamma rays are represented as expanding circles reminiscent of raindrops on water. Both the maximum size of the circle and its color represent the energy of the gamma ray, with white lowest and magenta highest. The movie starts on June 14 and ends June 17. The area shown is a region of the sky five degrees on a side and centered on the position of 3C 279.
Credit: NASA/DOE/Fermi LAT Collaboration
For More Information
Credits
Please give credit for this item to:
NASA's Goddard Space Flight Center. However, individual items should be credited as indicated above.
-
Producer
- Scott Wiessinger (USRA)
-
Writer
- Francis Reddy (Syneren Technologies)
-
Animator
- Jeremy Perkins (NASA/GSFC)
Missions
This page is related to the following missions:Series
This page can be found in the following series:Datasets used
-
[Fermi: LAT]
ID: 216Fermi Gamma-ray Large Area Space Telescope (GLAST) Large Area Telescope (LAT)
This dataset can be found at: http://fermi.gsfc.nasa.gov
See all pages that use this dataset -
[Fermi]
ID: 687
Note: While we identify the data sets used on this page, we do not store any further details, nor the data sets themselves on our site.
Related
- ID: 12194
 Produced Video
 - ID: 11915
 Produced Video
Used as a Source In
- ID: 14799
 Produced Video
Release date
This page was originally published on Friday, July 10, 2015.
This page was last updated on Monday, February 26, 2018 at 11:56 AM EST.