2014 Global Temperature Announcement Live Shot Page
2014 Global Temperature Announcement
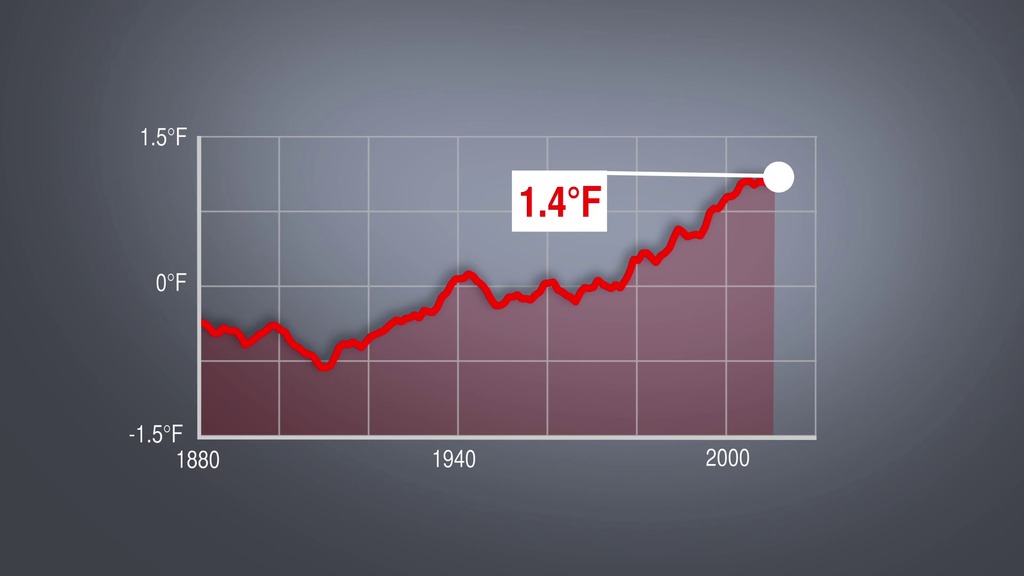
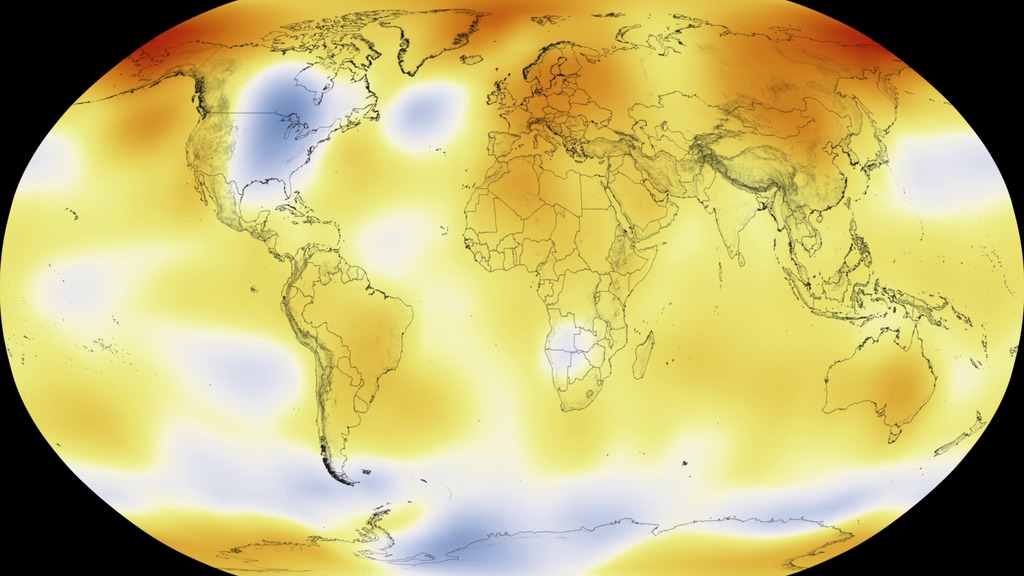
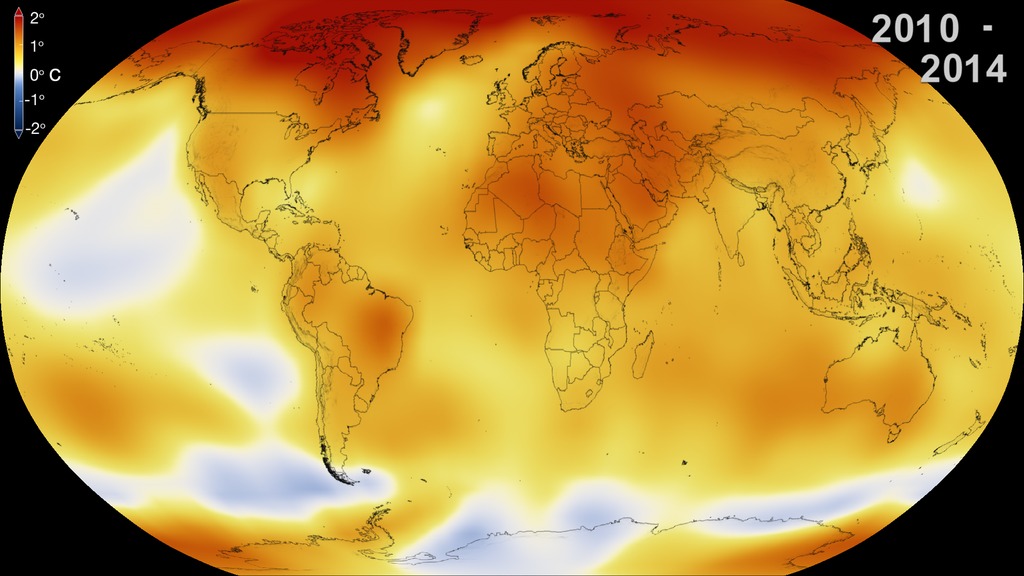
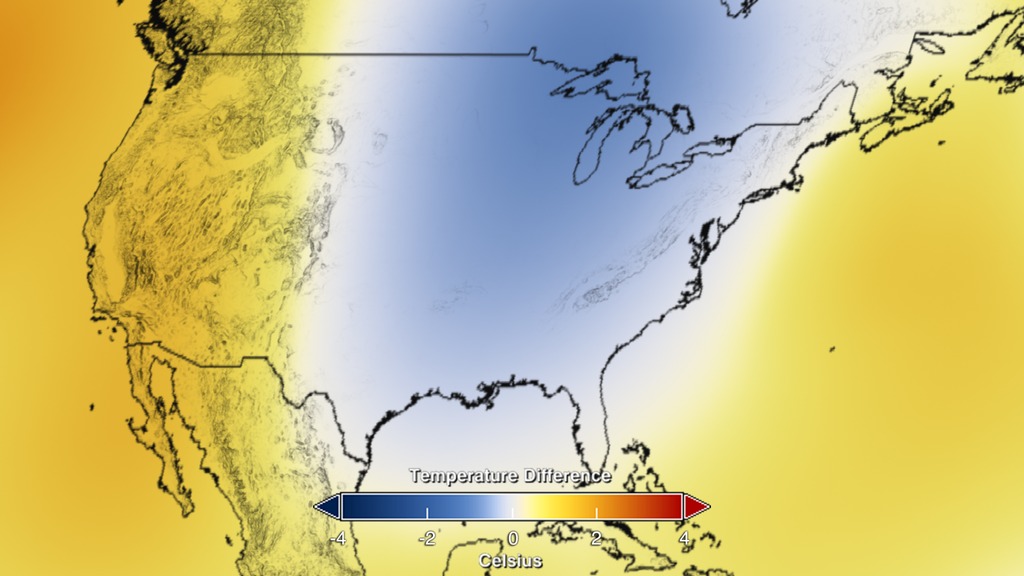
The year 2014 ranks as Earth’s warmest since 1880, according to two analyses released on Jan. 16. NASA scientists discussed the findings during live shot interviews on Jan. 16th.
NASA scientists track global temperatures as one way to measure how Earth’s climate is changing over time. Since 1880, the average global temperature has risen about 1.4 degrees Fahrenheit with most of that trend occurring in the last 30 years. Nine of the 10 warmest years in the modern record have occurred since 2000.
Canned interview featuring Dr. Jim Tucker
Canned interview featuring Steven Pawson.
Canned interview featuring Dr. Miguel Román.
Credits
Please give credit for this item to:
NASA's Goddard Space Flight Center
-
Data visualizer
- Lori Perkins (NASA/GSFC)
-
Producers
- Michelle Handleman (USRA)
- Patrick Lynch (Wyle Information Systems)
- Joy Ng (USRA)
- Claire Saravia (NASA/GSFC)
-
Video editors
- Stuart A. Snodgrass (HTSI)
- Michael Randazzo (Advocates in Manpower Management, Inc.)
Related
- ID: 11727
 Produced Video
 - ID: 11730
 Produced Video
 - ID: 11731
- ID: 4252
 Visualization
 - ID: 4254
 Visualization
 - ID: 4255
Release date
This page was originally published on Friday, January 16, 2015.
This page was last updated on Wednesday, May 3, 2023 at 1:50 PM EDT.