Super Typhoon
The western Pacific Ocean is a breeding ground for typhoons. On October 2, 2014, the region gave birth to one of the year’s most powerful storms—Typhoon Vongfong. Within days of its formation the storm intensified into a Category 5 typhoon, with maximum sustained wind speeds greater than 160 mph. Multiple NASA satellites, along with astronauts aboard the International Space Station, observed the typhoon as its rotating eye headed north toward Japan. One such satellite, called the Global Precipitation Measurement (GPM) Core Observatory, provided data on the location and intensity of precipitation falling from inside the storm. The measurements are used by scientists to monitor storms and make improved forecasts. Watch the video to see GPM’s view of Vongfong as it flew over the typhoon on October 9, 2014.

Explore views of Typhoon Vongfong taken from space.
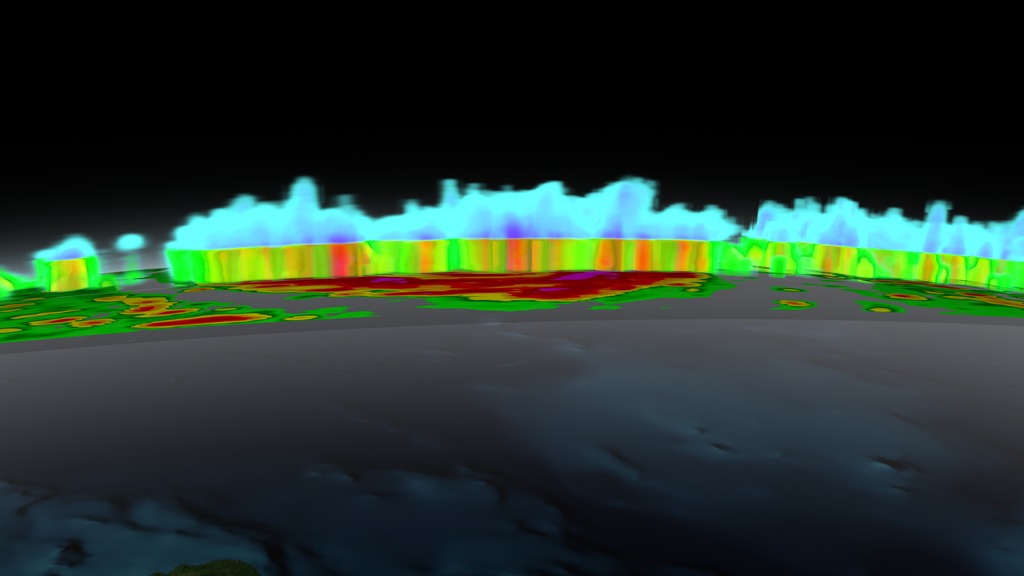
This visualization shows a 2D and 3D view of the storm's precipitation. Areas with high rates are red; low rates are green.
This image of Typhoon Vongfong was taken on October 9, 2014, by NASA's Aqua satellite.
Features of the storm, including the structure of its eye and frozen precipitation (blue), can be seen in the GPM data.
The storm produced heavy precipitation that fell over a large area.
Credits
Please give credit for this item to:
NASA's Goddard Space Flight Center
Cover image courtesy of NASA/JSC/ISS
Aqua satellite image courtesy of NASA/GSFC/MODIS Rapid Response Team
-
Animators
-
Kel Elkins
(USRA)

-
Alex Kekesi
(Global Science and Technology, Inc.)
-
Greg Shirah
(NASA/GSFC)
-
Kel Elkins
(USRA)
-
Producers
- Ryan Fitzgibbons (USRA)
- Rani Gran (NASA/GSFC)
-
Scientists
- Gail Skofronick Jackson (NASA/GSFC)
- Dalia B Kirschbaum (NASA/GSFC)
-
George Huffman
(NASA/GSFC)
-
Project support
- Laurence Schuler (ADNET Systems, Inc.)
- Ian Jones (ADNET Systems, Inc.)
-
Writer
- Kayvon Sharghi (USRA)
Related
- ID: 4229
 Visualization
Release date
This page was originally published on Tuesday, October 28, 2014.
This page was last updated on Wednesday, May 3, 2023 at 1:50 PM EDT.