IRIS Launch
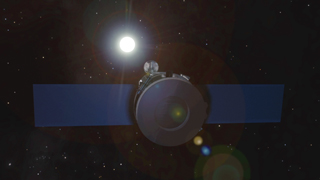
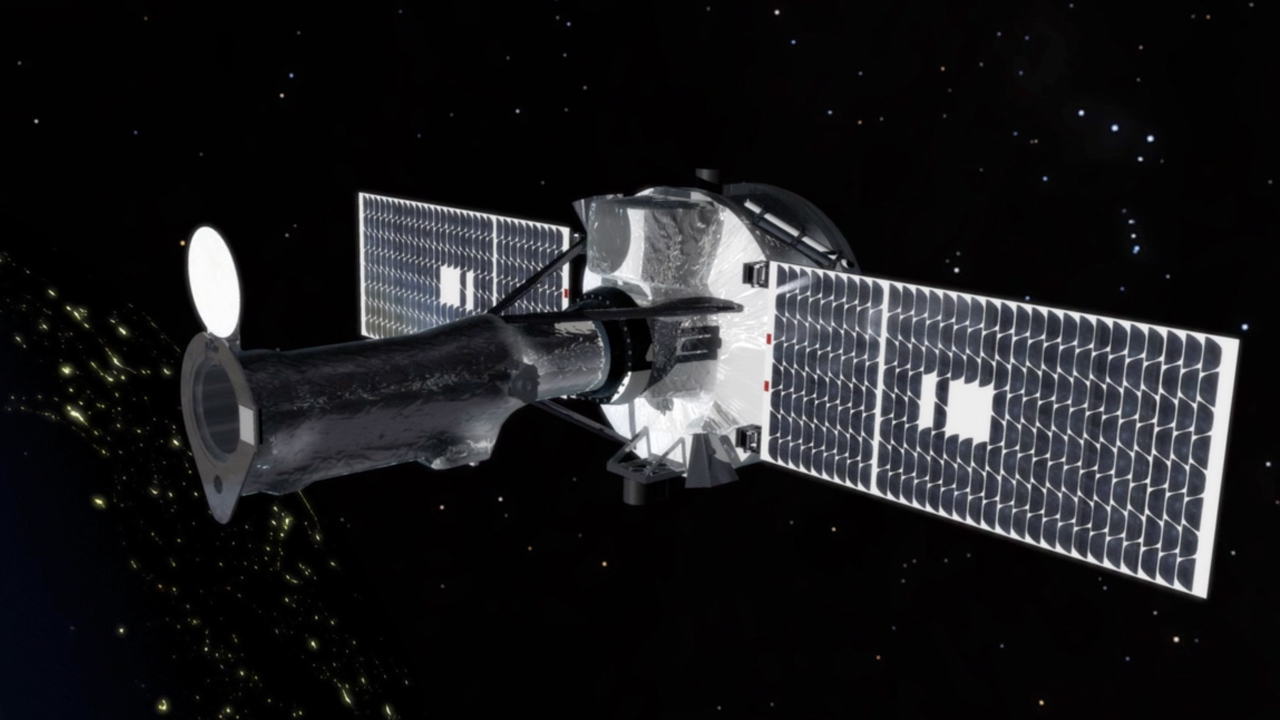
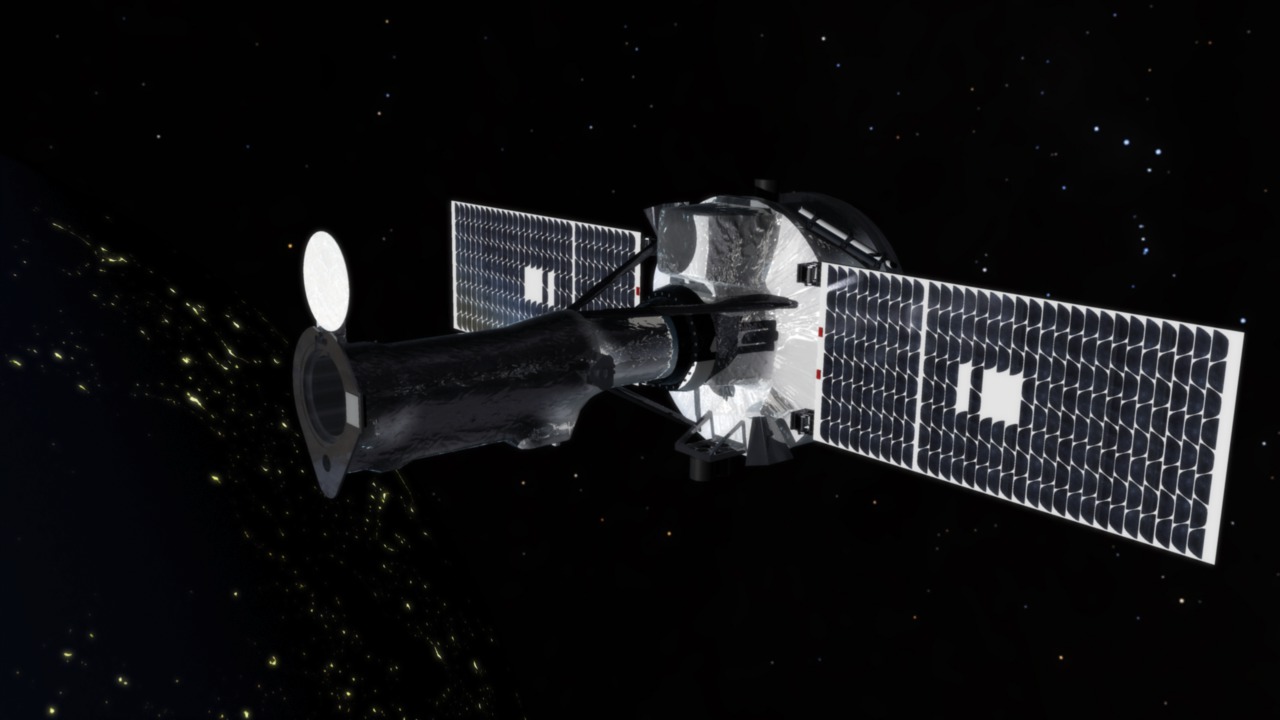
NASA's Interface Region Imaging Spectrograph (IRIS) solar observatory separated from its Pegasus rocket and is in the proper orbit. This followed a successful launch by the Orbital Sciences Pegasus XL rocket from Vandenberg Air Force Base, Calif. It was the final Pegasus launch currently manifested by NASA. NASA's Launch Services Program at the agency's Kennedy Space Center in Florida managed the countdown and launch.
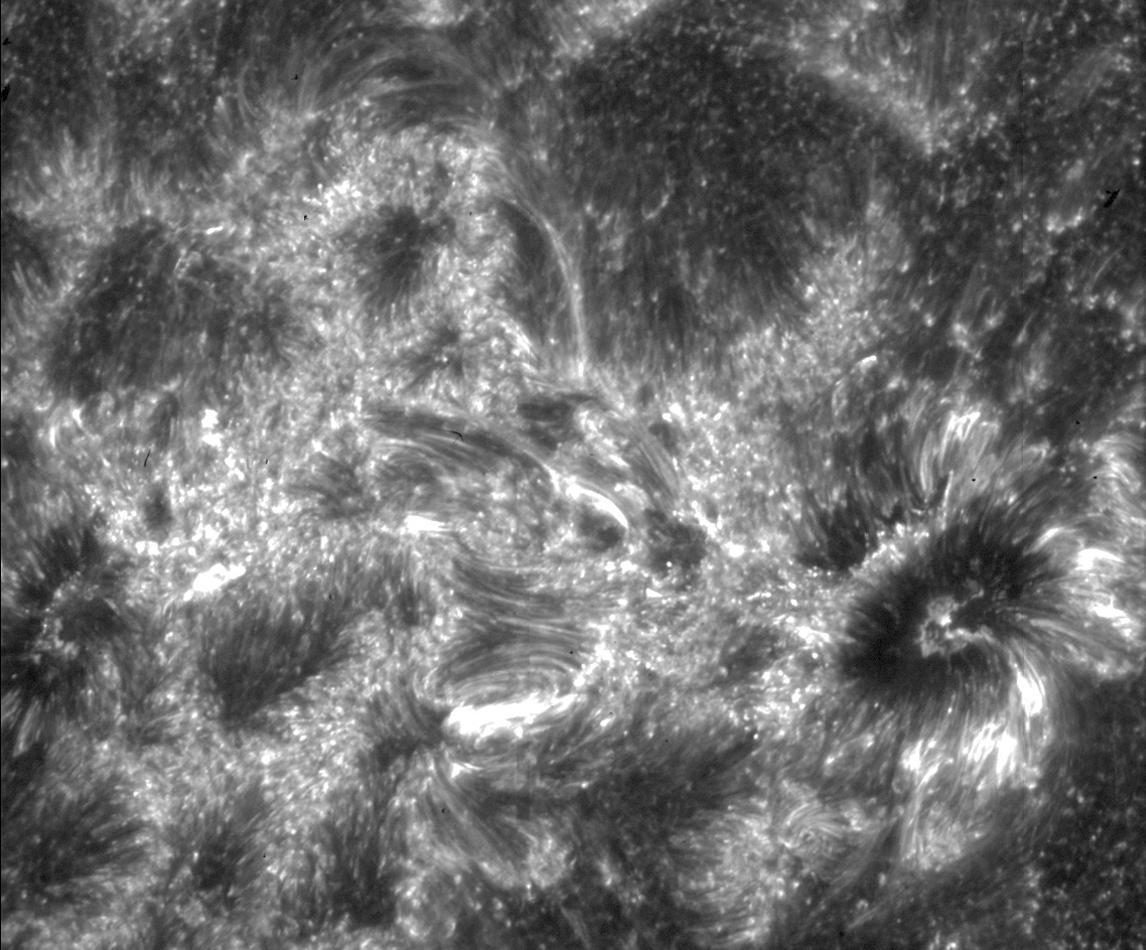
IRIS is a NASA Small Explorer Mission to observe how solar material moves, gathers energy and heats up as it travels through a little-understood region in the sun's lower atmosphere. This interface region between the sun's photosphere and corona powers its dynamic million-degree atmosphere and drives the solar wind.NASA's Interface Region Imaging Spectrograph (IRIS) spacecraft launched Wednesday at 7:27 p.m. PDT (10:27 p.m. EDT) from Vandenberg Air Force Base, Calif. The mission to study the solar atmosphere was placed in orbit by an Orbital Sciences Corporation Pegasus XL rocket.
B-roll of the Pegasus rocket that sent NASA's IRIS spacecraft into orbit.
Credit: NASA TV.
Credits
Please give credit for this item to:
NASA's Goddard Space Flight Center
Missions
This page is related to the following missions:Related
- ID: 11314
 Produced Video
 - ID: 11256
- ID: 11286
 Produced Video
 - ID: 11089
 Produced Video
Release date
This page was originally published on Friday, July 19, 2013.
This page was last updated on Wednesday, May 3, 2023 at 1:51 PM EDT.