New Active Region on Sun Produces Three Flares Including an X1 on March 5
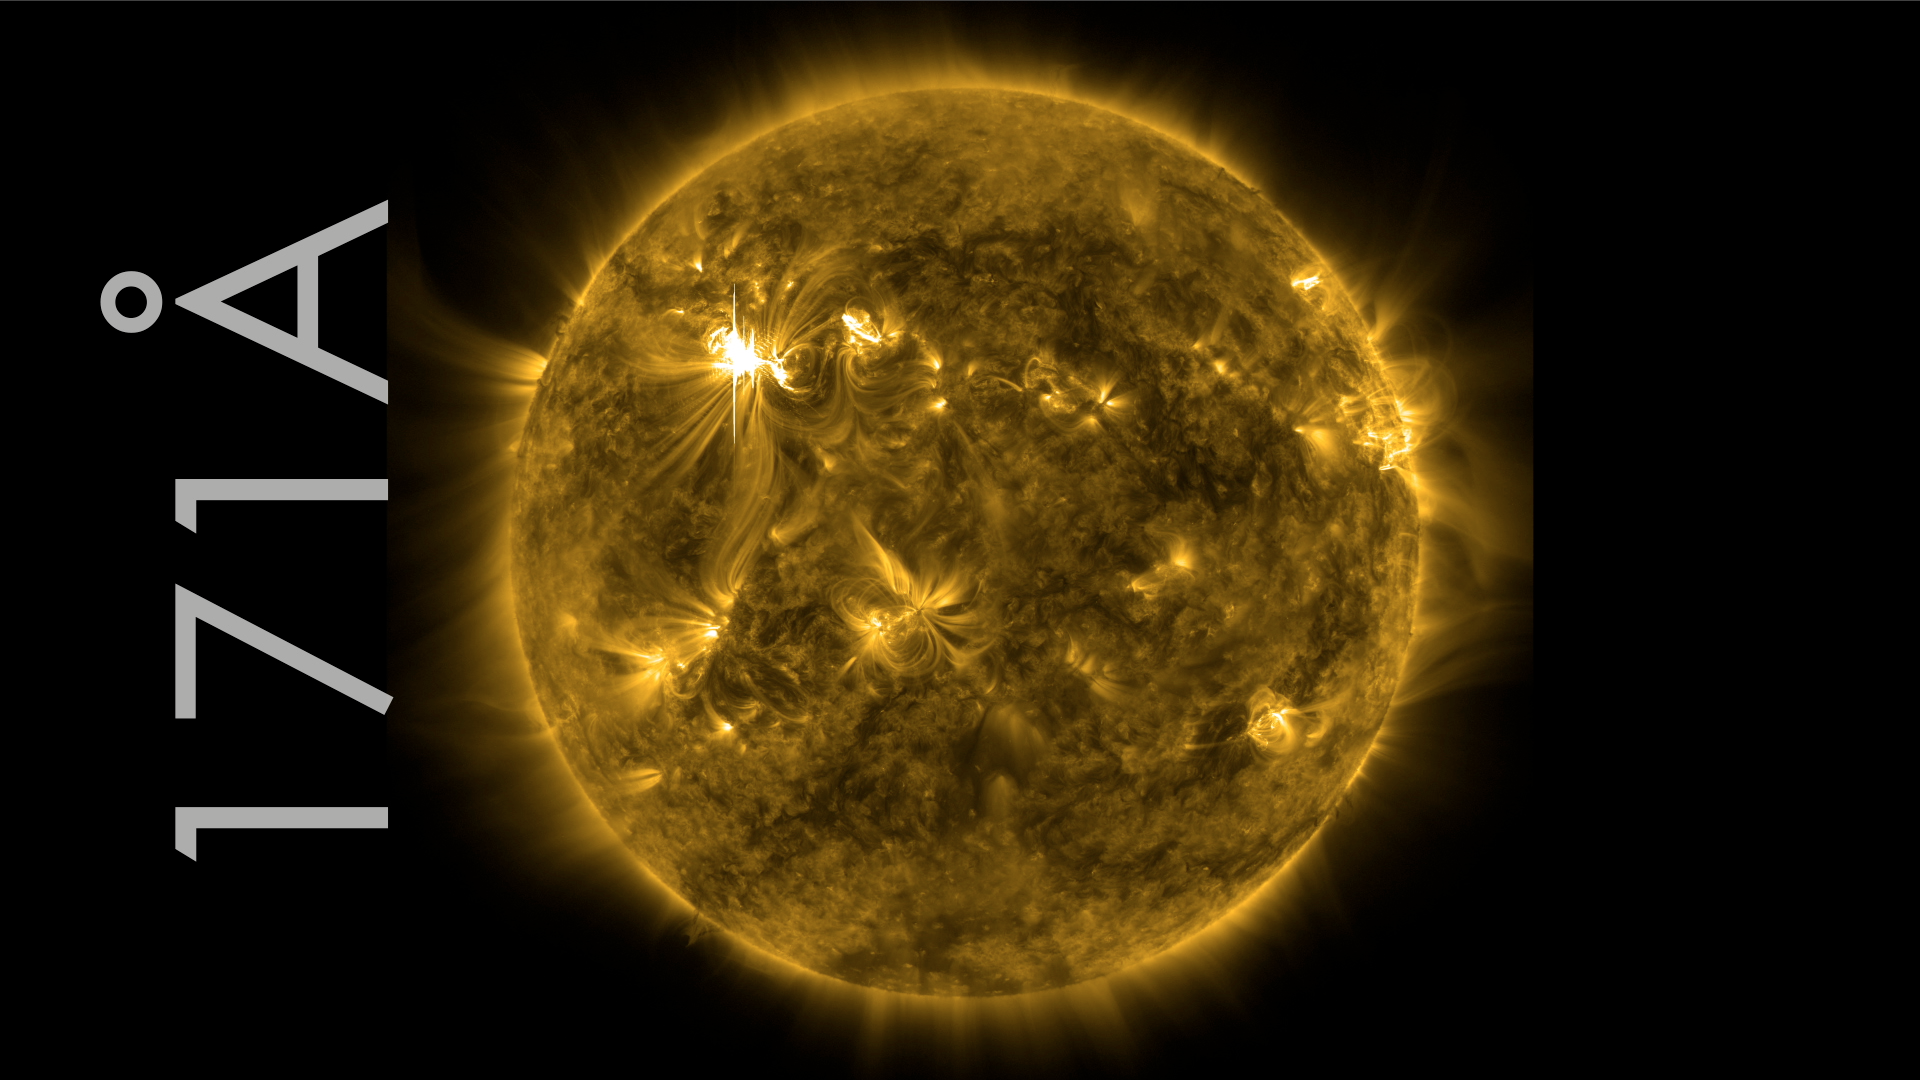
On March 2, 2012 a new active region on the sun, region 1429, rotated into view. It has let loose two M-class flares and one X-class so far. The M-class flares erupted on March 2 and on March 4. The third flare, rated an X1, peaked at 10:30 ET on March 4. A CME accompanied each flare, though due to the fact that this active region is still off to the side of the sun, they will likely have a weak effect on Earth's magnetosphere.
The M class flare on March 4 flare also came with what's called a Type IV radio burst that lasted for about 46 minutes. Sending out broadband radio waves, these bursts can occur towards the end of a solar flare and are believed to be created by moving electrons trapped in great, looping magnetic fields left over from the initial flare. The bursts can interfere with radio communications on Earth.
Short, edited video of X1 flare in 171.
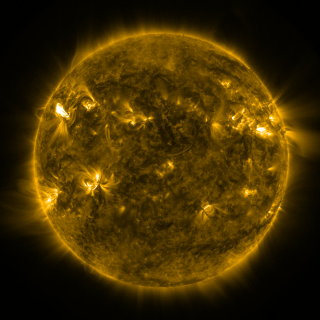
2kx2k full-disk video of March 5 X1 flare from JHelioviewer. The footage comes from the Solar Dynamics Observatory. It is a wavelength of 171 angstroms, which is in the extreme ultraviolet, and highlights plasma in the corona at temperatures of 600,000 Kelvin.
Zoomed in video of March 5 X1 flare from JHelioviewer. The footage comes from the Solar Dynamics Observatory. It is a wavelength of 171 angstroms, which is in the extreme ultraviolet, and highlights plasma in the corona at temperatures of 600,000 Kelvin.
2kx2k full-disk video of March 5 X1 flare from JHelioviewer. The footage comes from the Solar Dynamics Observatory. It is a wavelength of 131 angstroms, which is in the extreme ultraviolet, and highlights plasma in the corona at temperatures of 10 Million Kelvin.
For More Information
Credits
Please give credit for this item to:
NASA/Goddard Space Flight Center
-
Video editor
- Scott Wiessinger (USRA)
-
Producer
- Scott Wiessinger (USRA)
-
Writer
- Karen Fox (ADNET Systems, Inc.)
Missions
This page is related to the following missions:Series
This page can be found in the following series:Datasets used
-
[SDO]
ID: 168This dataset can be found at: http://sdo.gsfc.nasa.gov/
See all pages that use this dataset -
AIA 171 (171 Filter) [SDO: AIA]
ID: 680This dataset can be found at: http://jsoc.stanford.edu/
See all pages that use this dataset -
AIA 131 (131 Filter) [SDO: AIA]
ID: 730This dataset can be found at: http://jsoc.stanford.edu/
See all pages that use this dataset
Note: While we identify the data sets used on this page, we do not store any further details, nor the data sets themselves on our site.
Related
- ID: 3904
 Visualization
 - ID: 10925
 Produced Video
Release date
This page was originally published on Monday, March 5, 2012.
This page was last updated on Wednesday, May 3, 2023 at 1:53 PM EDT.